Introduction:
As we illustrated in previous modules, session search can be used to search and identify sessions based on conditions and criteria you select, allowing you to locate sessions for further analysis. With a list of sessions created by your defined criteria, you can replay sessions to view the customer experiences and work with session data to gain increased visibility into user interactions on your site and uncover areas to optimize the customer experience.
Key benefit:
Procedure:
Replay sessions
You can watch session replays in two different modes using IBM Tealeaf on Cloud. In one mode, you can review a session replay in “movie format,” allowing you to view the session as it occurred and observe the overall flow of the session. The second method offers you the ability to analyze the session replay page by page, allowing you to perform a more detailed analysis on actions taken on each page in a session.
1. From the list of sessions displayed in the Session Results page, you can select to replay a specific session by clicking the blue play icon that appears in the row for the session you want to replay, as shown by the red arrow in the image below. 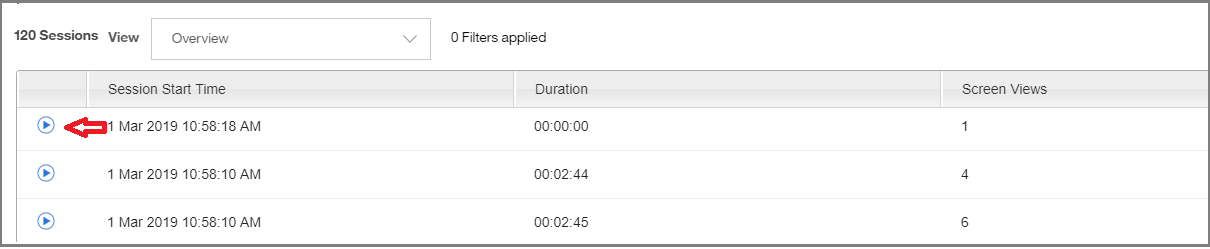
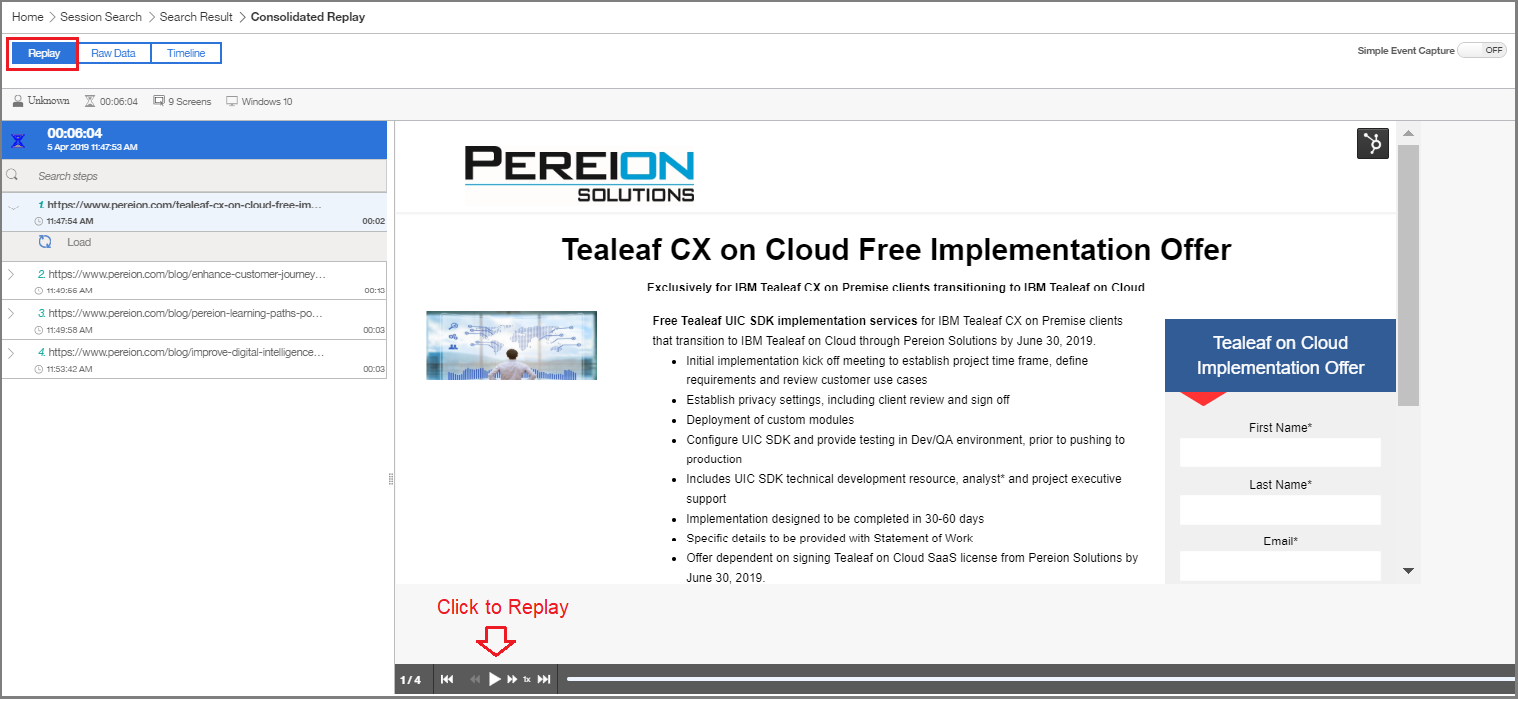
2. The session replay screen will appear where you can click to replay the session in “movie format,” as shown by the red arrow in the image below, allowing you to view a replay of the visitors session as it occurred and analyze user interactions such as clicking buttons or accessing links, filling out a form, or selecting from a list, etc., with each web page or mobile application.
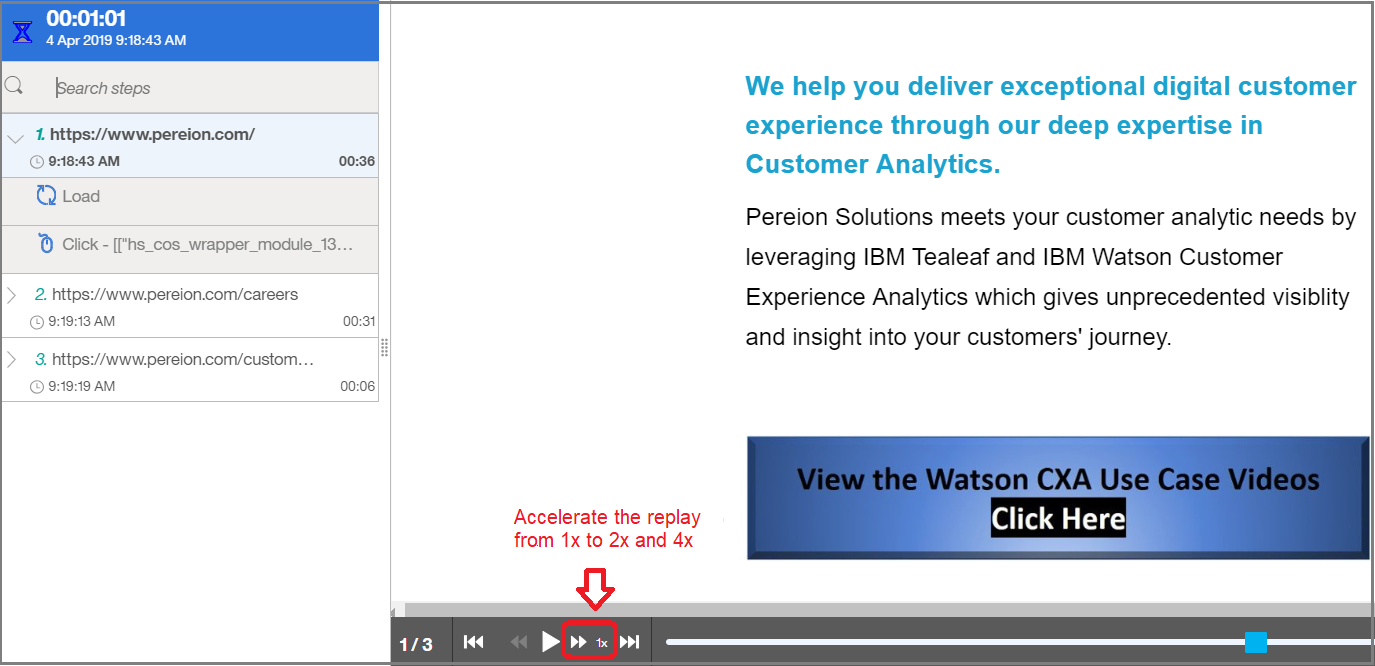
3. Using the “movie format” method of session replay, you can also accelerate the replay by clicking on the forward arrow next to the 1x, as shown by the red arrow in the image below, to increase the replay from 1x to 2x or 4x, which is helpful if you are just trying to observe the flow of the session.
4. From the session replay view, you can also select to analyze the session replay page by page and drill down into steps taken in a session for further analysis. To drill down into the individual session pages and identify the specific actions the user took on each page, click the arrow next to each step as shown with red arrows in the image below.
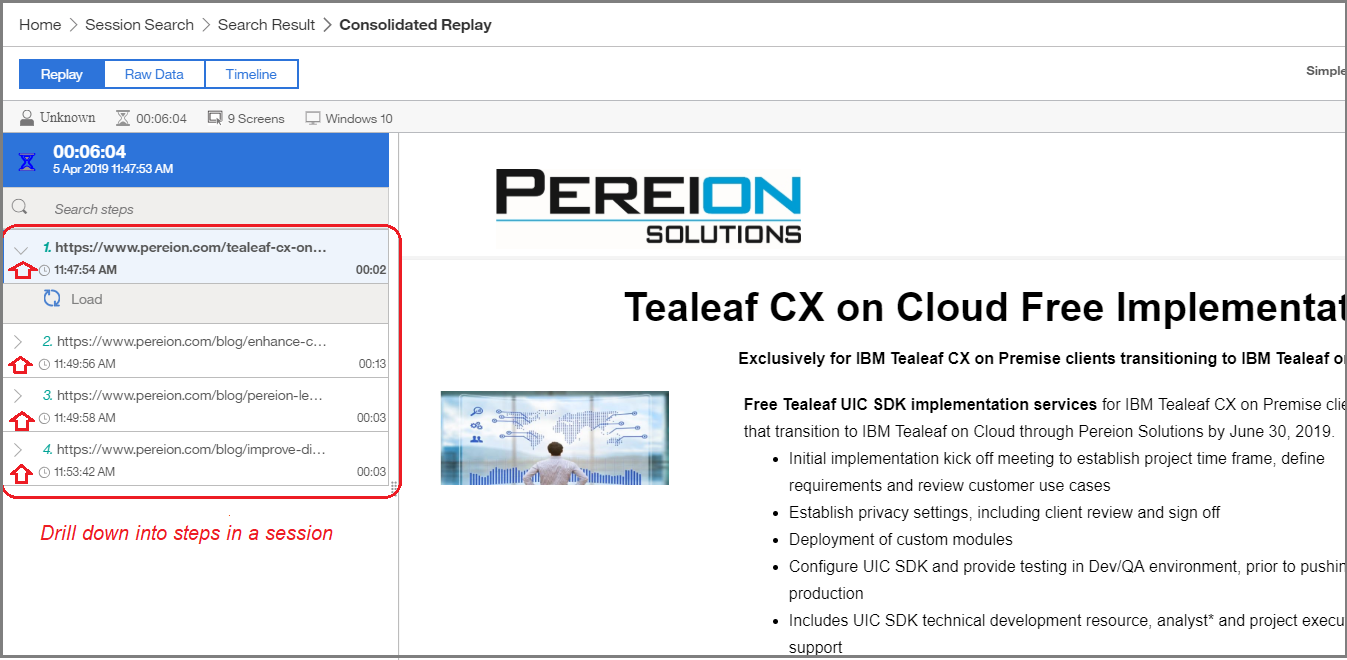
Session replay analysis allows you to observe the flow of session and see the pages where users navigated, the actions they took on each page and how long they stayed on a page, helping you understand user pain points and identify struggles that visitors encountered with your website or application.
Analyze Session timeline
In Session timeline view, you can view a chronological list of the events that occurred during the session.
1. To access the session timeline view, select Timeline from the upper left of the screen, as shown in the image below. The events that occurred in each step of the session will be listed to the right, as shown by the red arrow in the image below.
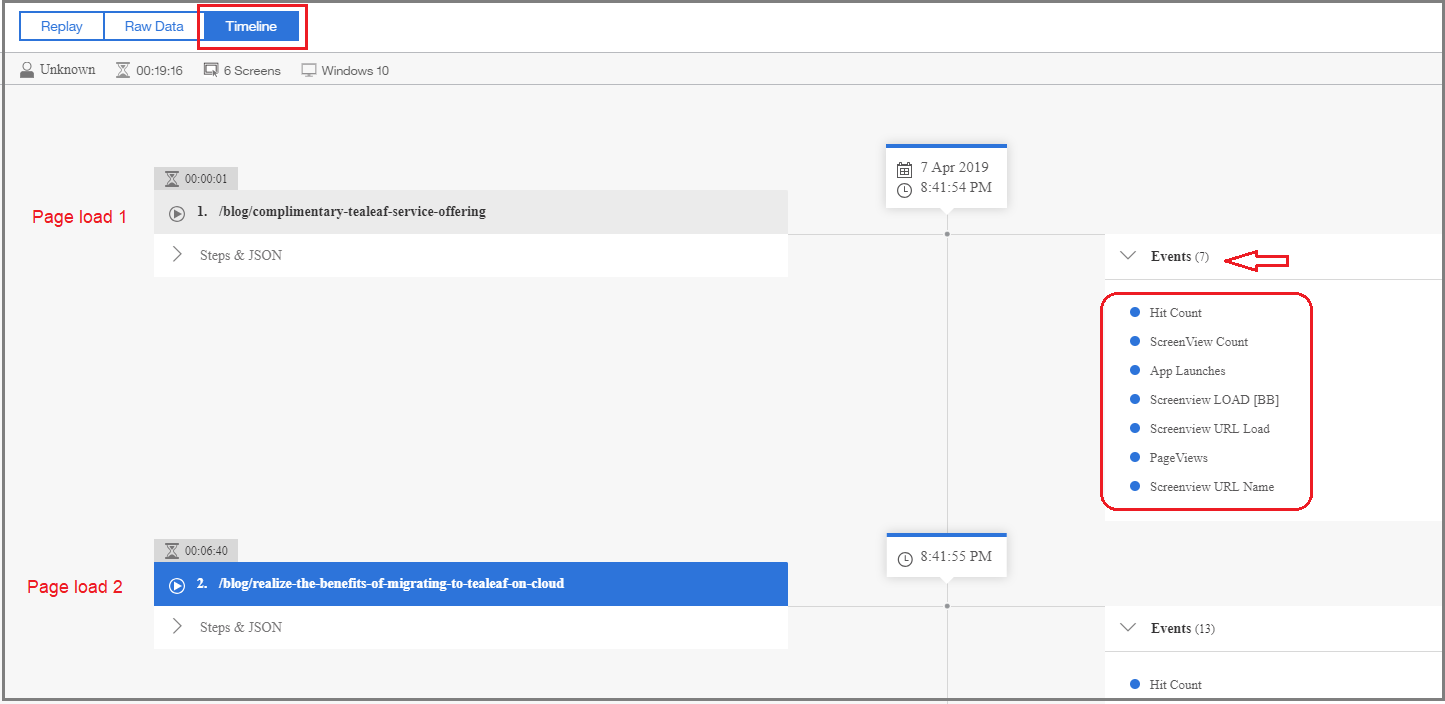
The session timeline displays: events, event duration, page URL, session date, start time, steps & JSON
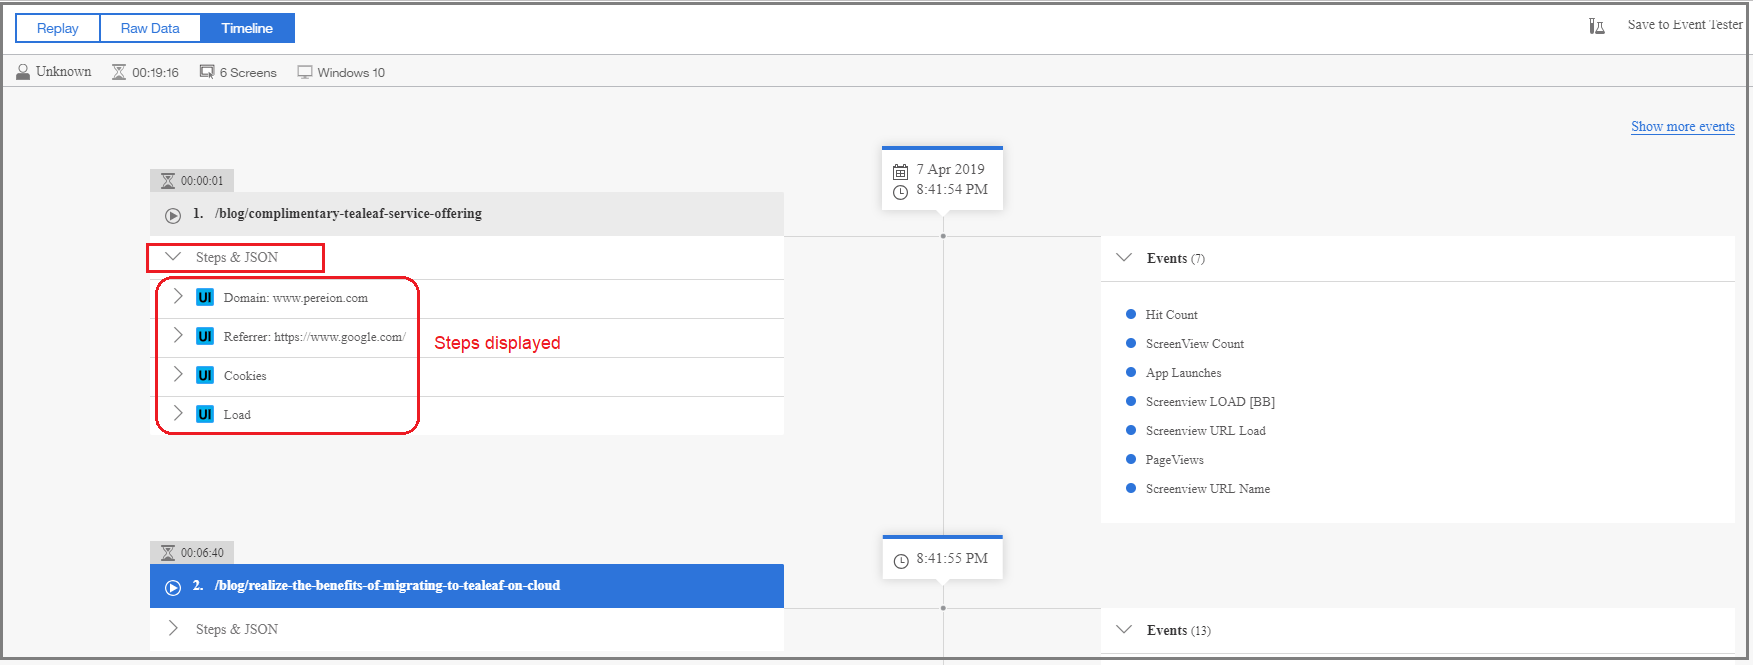
2. Click the Steps & JSON tab on the left side of the page to display the steps below the session URL, as shown in the image below.
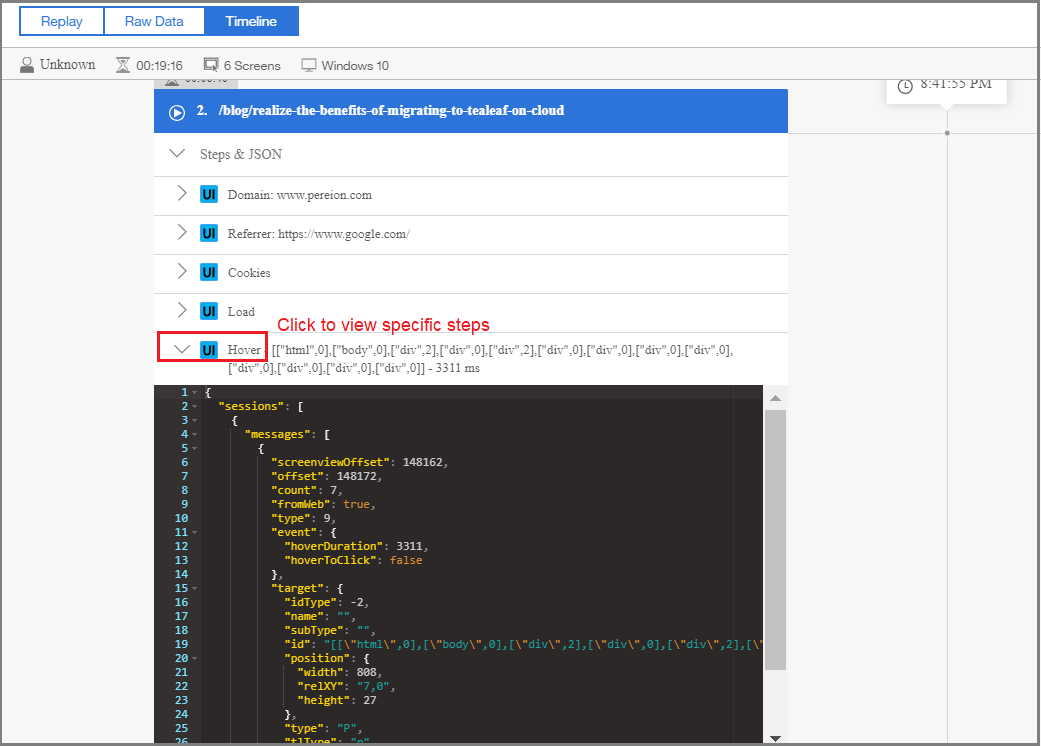
3. Click a specific step to display the JSON data, as shown in the image below. You can view the detailed data for cookies, scrolls, hovers, referring domains, and more, allowing you a view into the exchange of data and events taking place on your site.
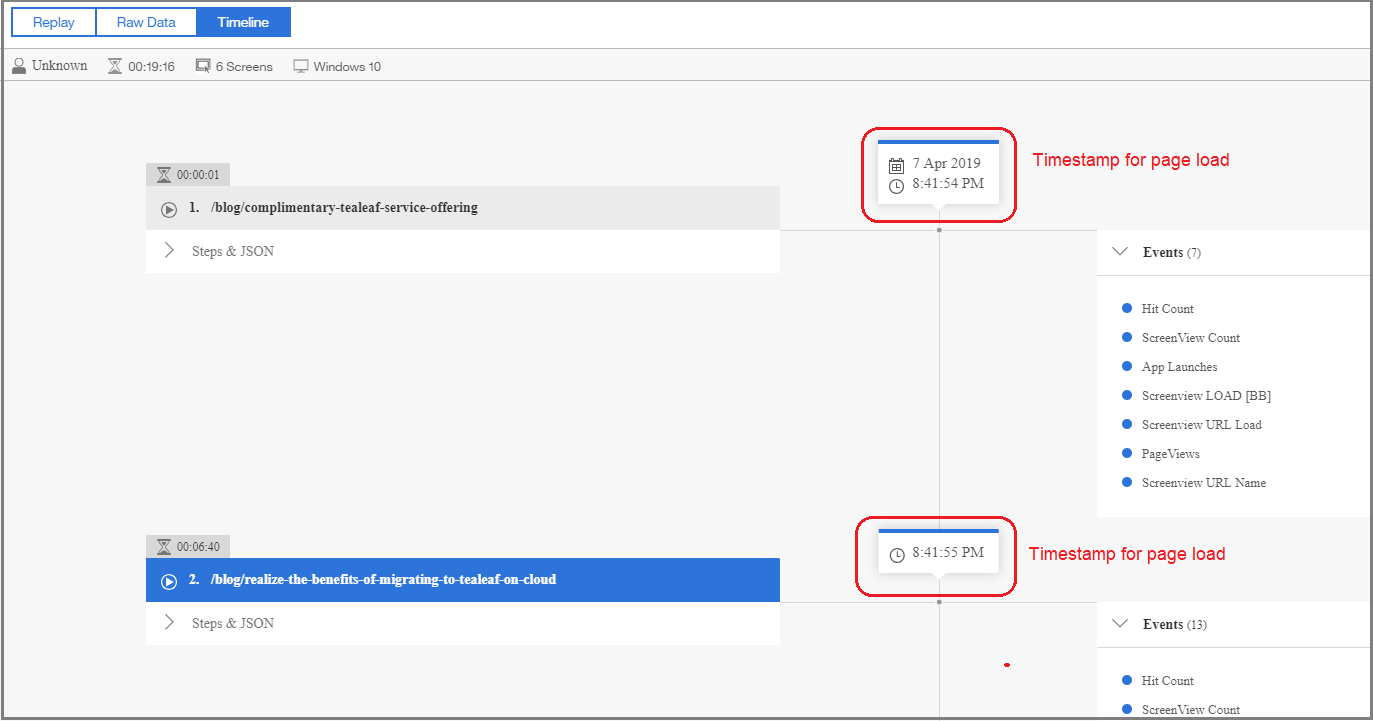
4. Scrolling through the session timeline, you can also see the timestamps for each page session that was loaded in replay, as shown in the image below.
View Raw data
In Raw data view, you can view the code and raw website data of the steps in a session replay. You can also create events, step attributes, and hit attributes from within the code.
1. To access the Raw data view, select Raw Data from the upper left of the screen, as shown in the image below. The Request data will appear to the left and the Response data (when clicked) will appear to the right, as shown by the red arrows in the image below.
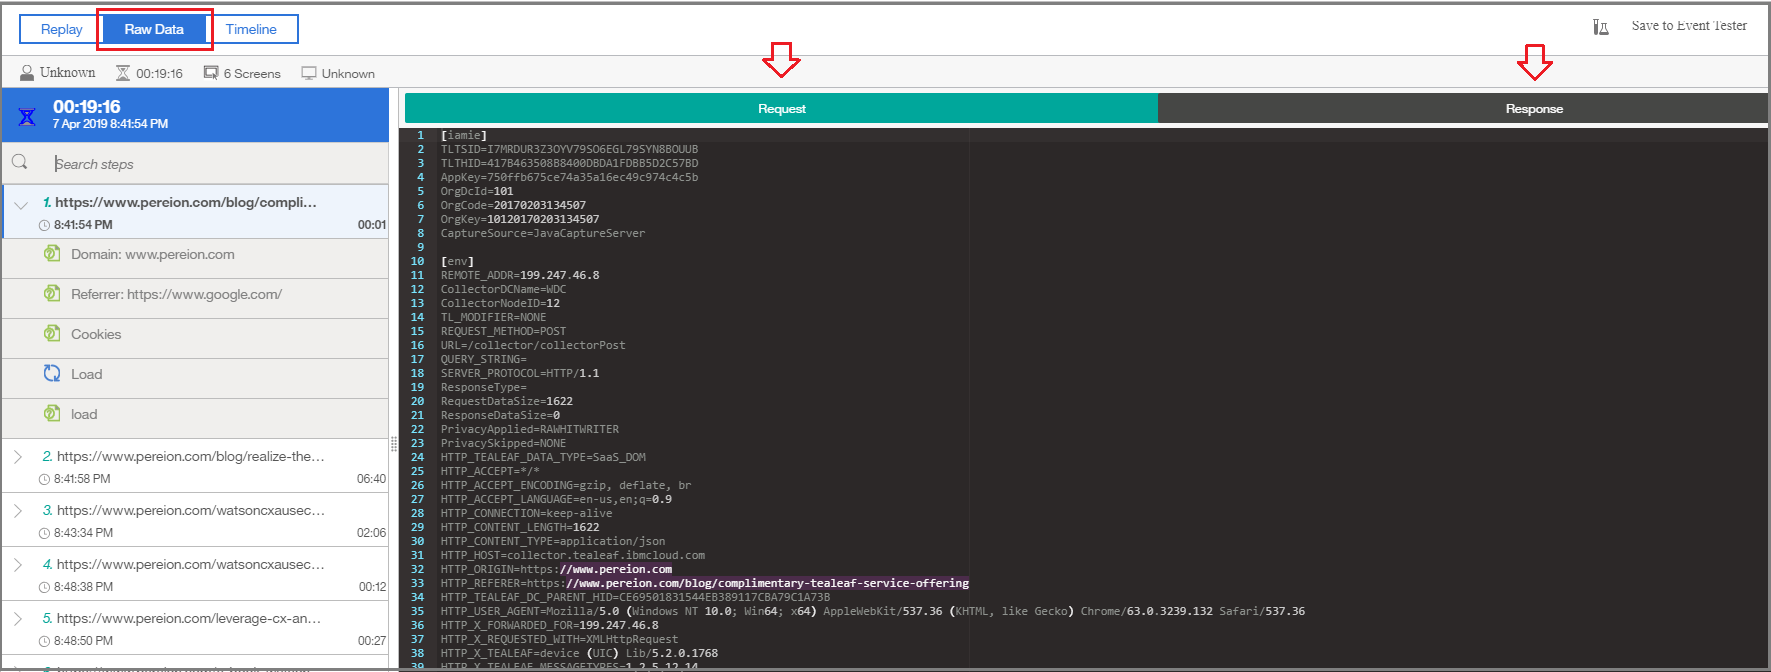
2. The Request data tab displays the HTTP request data that was sent from the visitor's browser, as shown in the first image below, and the Response data tab displays the HTML response detail returned by the web server, as shown in the second image below.
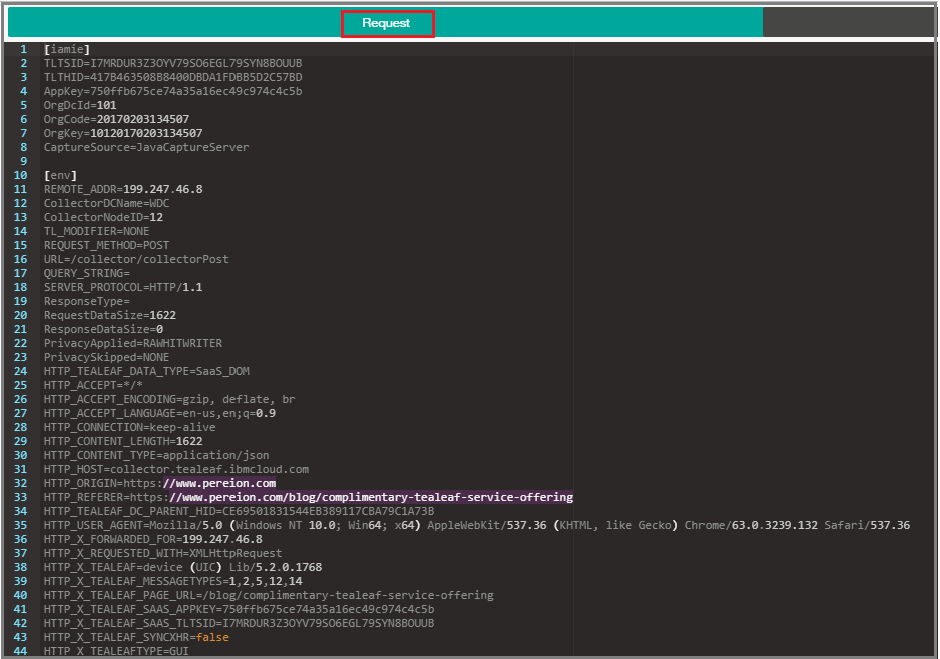 Request Data sent from visitor's browser
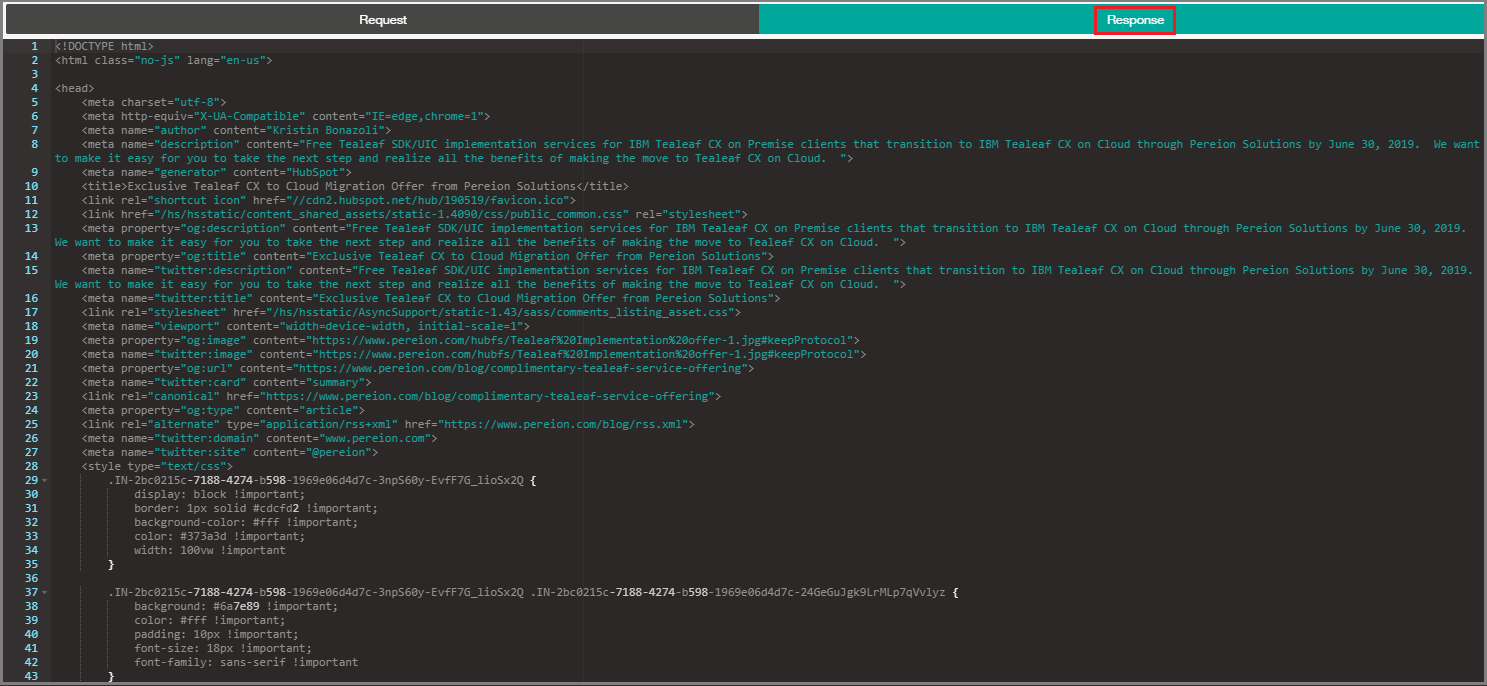 Response data returned by web server
Using session replay and analysis can provide data-driven insight into customer struggles and offers you the opportunity to improve areas on your website that contributed to user confusion or frustration -- allowing you to optimize customer experiences across your site and applications.
Need more information? Request a consult with us for addition information or training topics by clicking here.
Click here to go back to the Tealeaf Fundamentals main page
