Introduction:
As there are many important events and metrics that you need to monitor across your site, creating the appropriate reports to track these events and metrics is key to ensuring you can readily identify – and quickly understand --- any issues with your online business. Creating standard reports can help you track crucial metrics and assist you with readily recognizing behavioral trends or spotting potential issues that may require further analysis.
Key Benefits:
Procedures:
Create Standard Reports
To create a standard report, do the following:
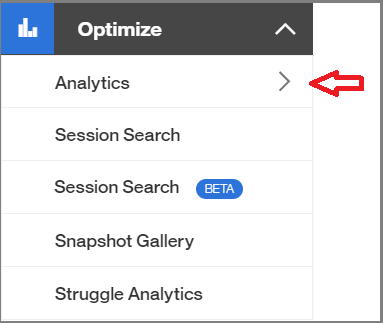
1. From the left navigation in Tealeaf, go to Optimize and select Analytics, as shown in the image below.
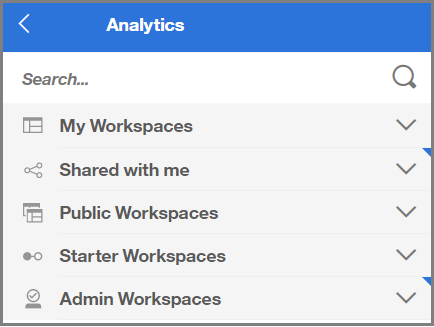
2. A list of available workspaces will display, as shown in the image below, where you can select the Workspace on which you would like to create the report.
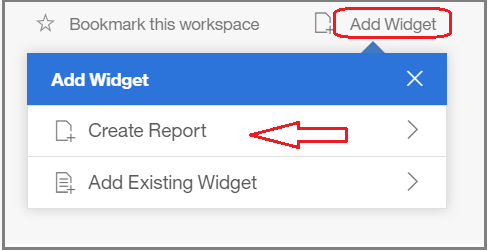
3. From the upper right of the workspace, select Add Widget and then Create Report, as shown in the image below.
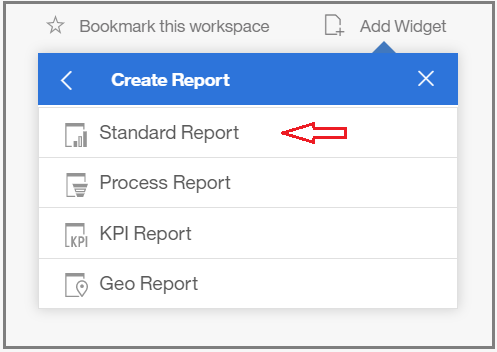
4. From the Create Report menu, select Standard Report, as shown in the image below.
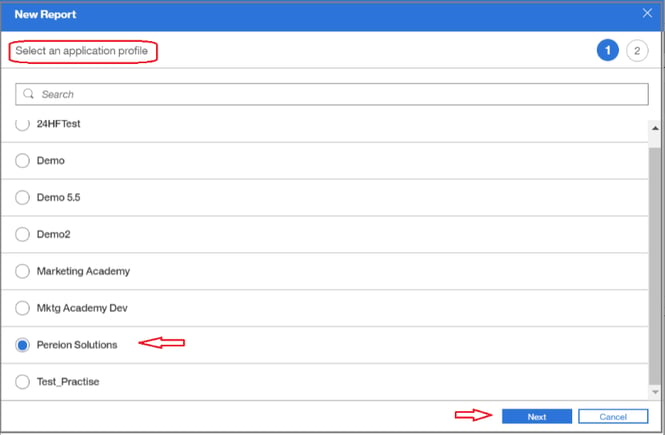
5. The New Report page is displayed where you can select an application profile and click Next, as shown in the image below. In our example, we have selected Pereion Solutions as our application.
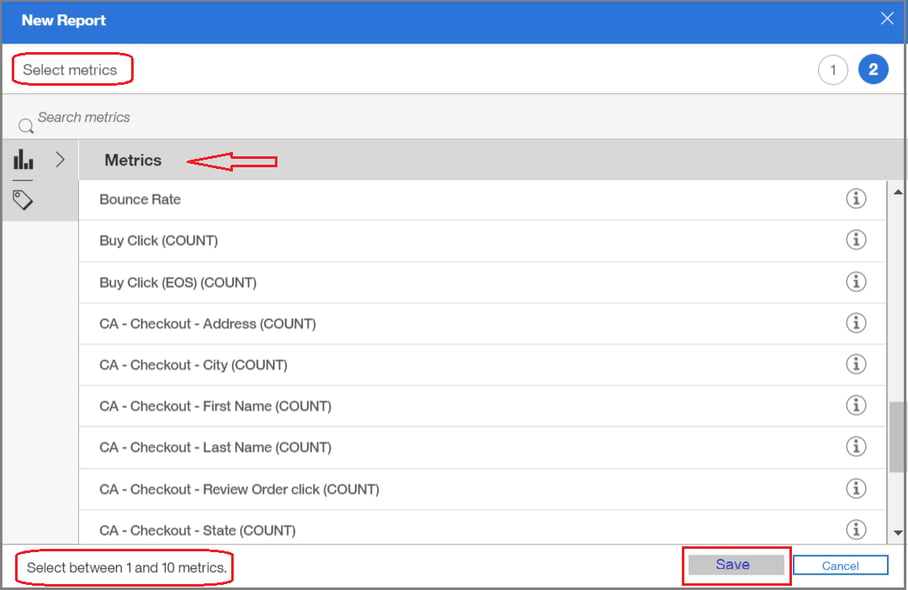
6. Next, you can select the metric or metrics you want to use to populate your report from the list of available metrics. Metrics are events you have created to monitor particular actions or incidents on your site. You can select up to 10 metrics for your report, and then click Save, as shown in the image below.
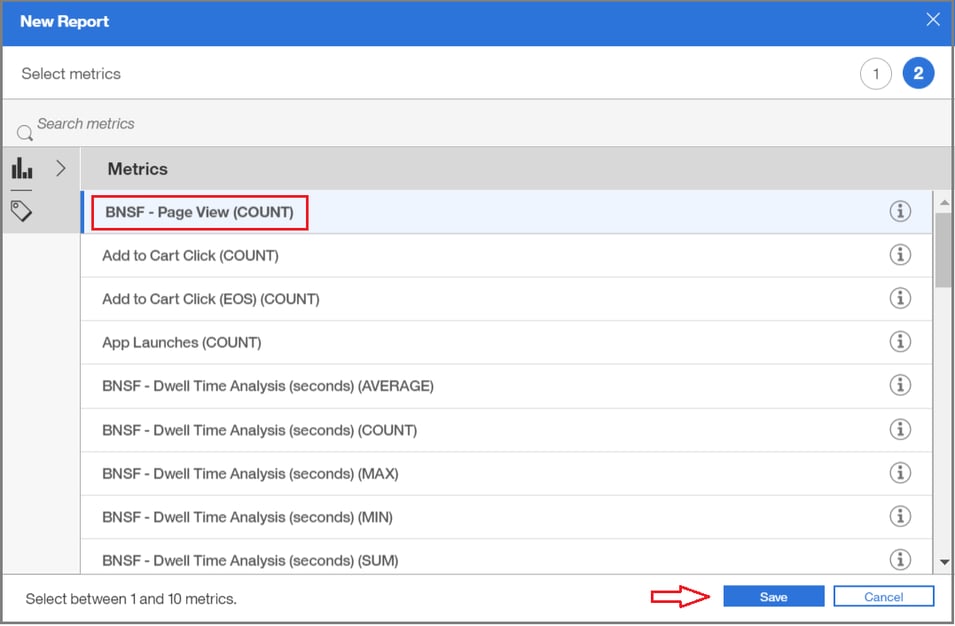
7. For our example, we have selected “Page View Count” as the metric for our report, as shown in the image below.
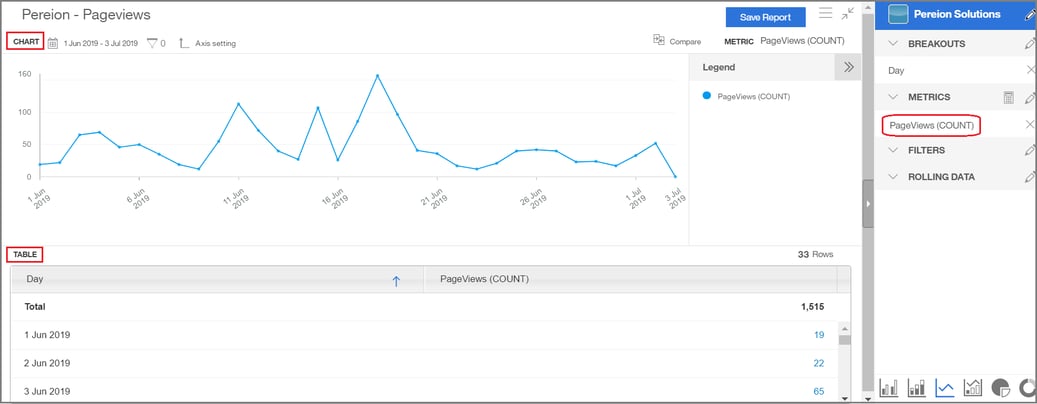
8. Once you click to save your selected metric(s), as shown in the image above, your report is displayed, as shown in the image below, with a chart format on the top and a table format on the bottom.
Customize standard reports
Apply Breakouts
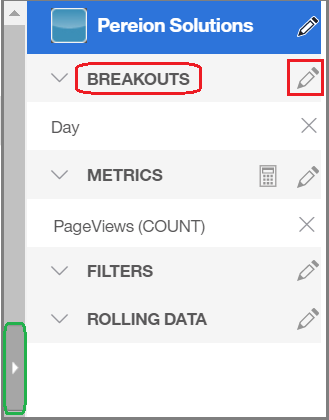
1. To the right of your newly-created report, a report builder menu is displayed, as shown in the image below, where you can customize your report. From this menu, you can apply dimensions or breakouts to your report, as well as apply filters and rolling data, to customize your report view.
Note: You can also hide this menu from view by clicking on the arrow, which is highlighted in green in the image below.
To select breakouts or dimensions for your report, click the edit symbol next to Breakouts, as highlighted in red in the image below.
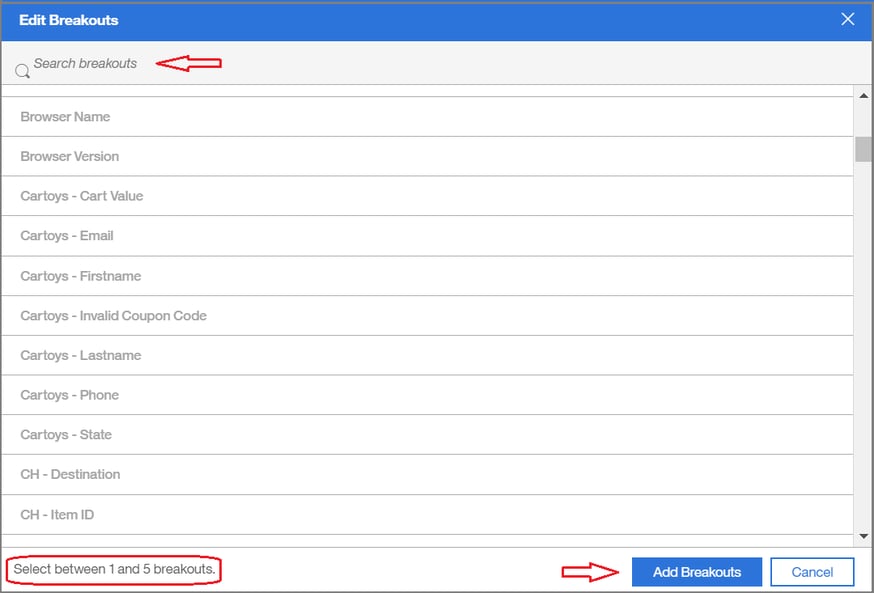
2. A list of available breakouts for your report will appear. You can choose to breakout your data by timeframes, as shown in the first image below, as well as select additional dimensions to refine the view of your data – like filtering by browser type, promo codes, search terms, etc. – as shown in the second image below. You can select one to five breakouts for your report and click Add breakouts.
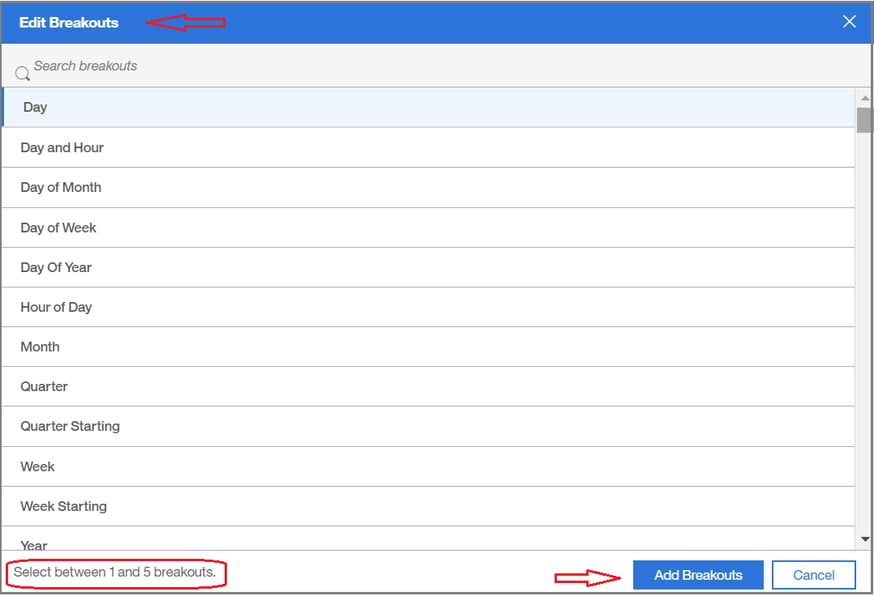 Customize your report by selecting different breakouts to segment your data
 Select one to five breakouts for your report and click Add Breakouts
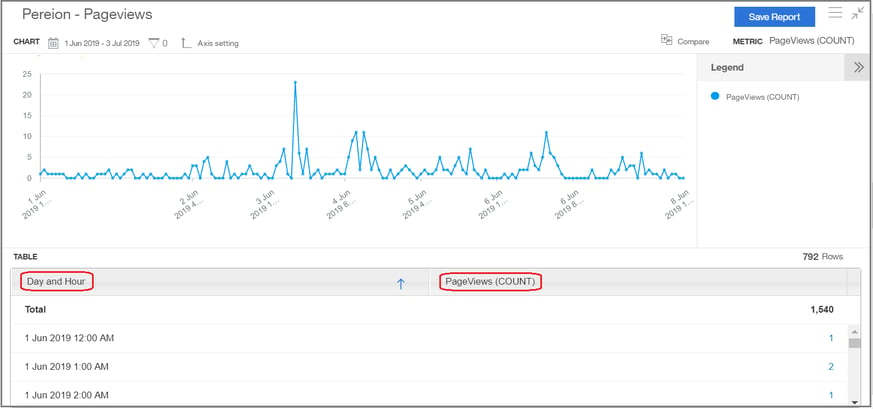
3. After you add breakouts to your report, the report view will refresh. In our example below, we have segmented our Page View Count report to view the data by Day and Hour.
Create Calculated Metrics
In some instances, it is beneficial to apply a calculated metric to your report to further analyze your customer behavior data. For example, you can use the CTA counts for a page and the view counts for a page to calculate the CTA rate for the page. In the example below, we will apply a calculated metric to a report on attempted checkouts versus completed checkouts to identify the ratio of attempted checkouts versus completed checkouts.
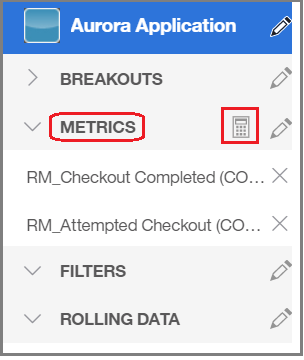
1. From the report builder menu on the right side of the report, click the calculator icon next to Metrics, as shown in the image below.
2. The calculator will open where you can select the metrics to use in your calculation, as shown in the image below.
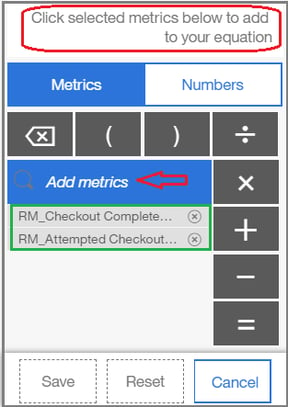
3. The metrics being tracked in the report will be listed, as shown by the green box in the image above. You can click on a listed metric(s) to select it as a metric for use in creating a calculation, as shown in the red box in the image below. Selected metric(s) will appear above in the calculation box, as highlighted in green in the image below.
4. You can also Click Add metrics, as shown with the red arrow in the image below, to select additional metrics for your calculation.
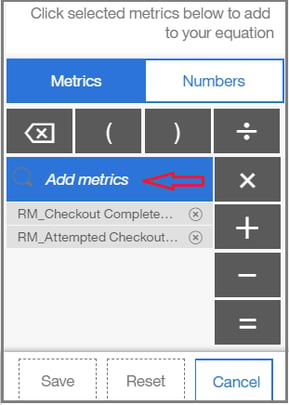
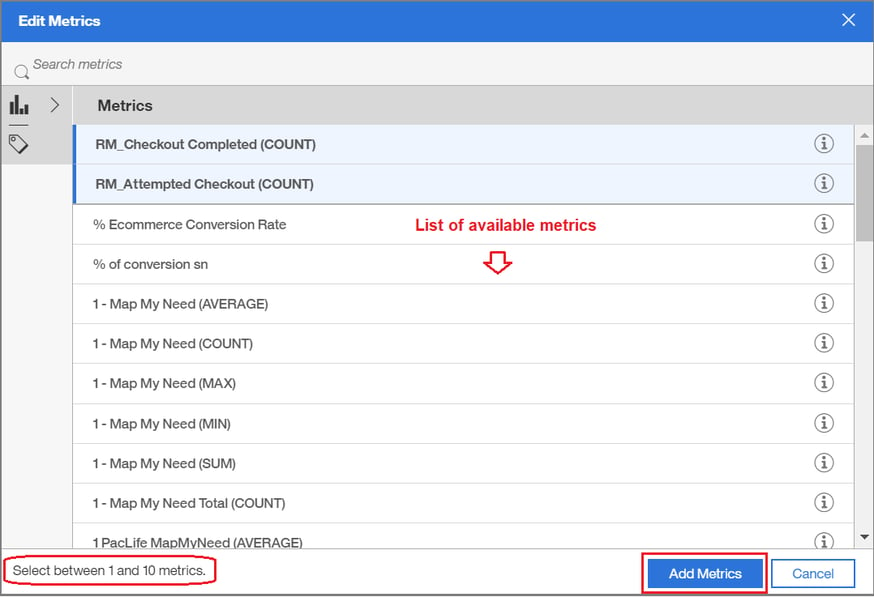
5. The list of available metrics will be displayed, as shown in the image below. Select the metric(s) and click Add Metrics. You can select up to 10 metrics.
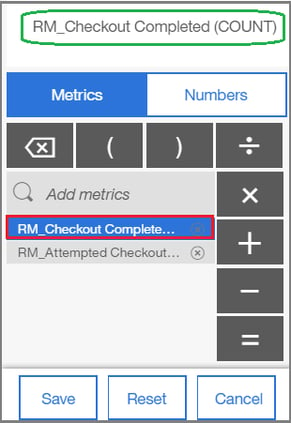
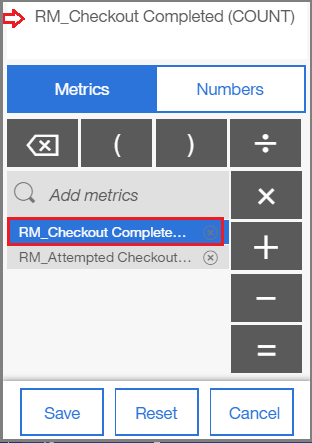
6. For the calculated metric in our example, we will create a calculated metric to divide the Checkout Complete (count) by the Attempted Checkout (count) to understand the ratio between the two metrics. First, select Checkout Complete (Count) from the list of metrics, as shown in the red box in the image below. The selected metric will then appear above in the calculator menu, as shown by the red arrow in the image below.
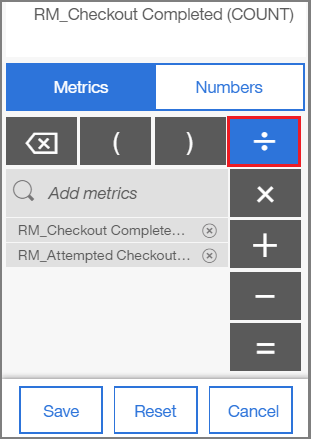
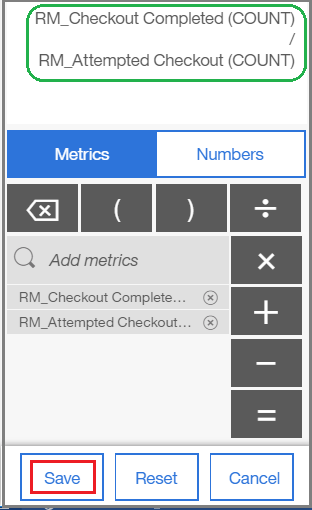
7. Next, select the calculation function to be applied in your calculated metric. In our example, we have selected to divide, as shown in the image below.
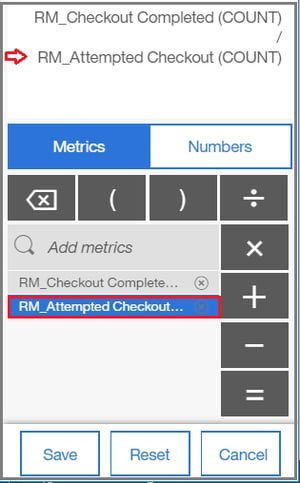
8. Then, select the next metric for the calculation. In our example, we will select Attempted Checkout (Count), as shown in the image below.
9. Once the calculation is configured, click Save, as shown in the image below.
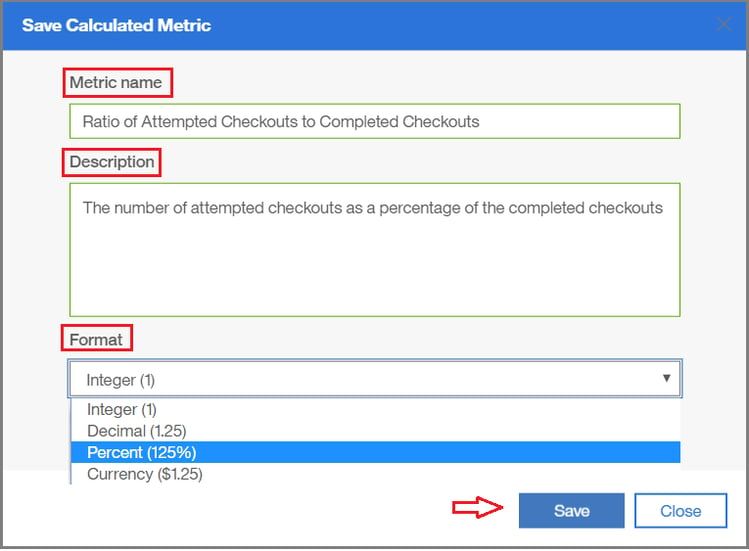
10. The Save Calculated Metric box will open, where you can provide a name and description for your calculated metric, as well as select a format for your calculated metric, as shown in the image below. After completing the information, click Save.
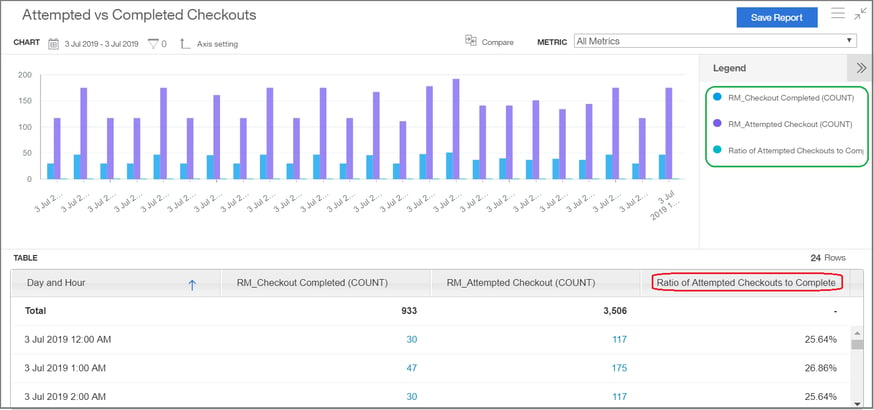
11. The report view will refresh and represent the report data (i.e. Checkout Completed and Attempted Checkout) along with the calculated metric (i.e. Ratio of Attempted Checkouts to Completed Checkouts), as shown in the image below. To save the updated report, click Save Report in the upper right.
Edit Dimension Filters
By applying filters to dimensions included in standard reports, you can further refine your report data and segment the information that is most important to your business. For our example, we will use a report on Gesture Counts by Mobile Platform, as shown in the image below, and edit the dimension filter for the Platform OS, which is one of the dimensions applied to this report.
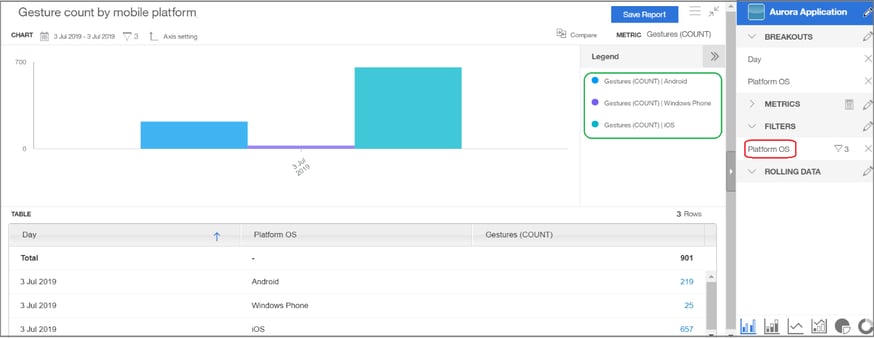
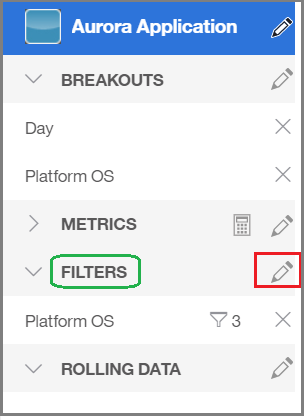
1. To edit the filter for dimensions, click the edit symbol next to Filters in the report builder menu, as highlighted in red in the image below.
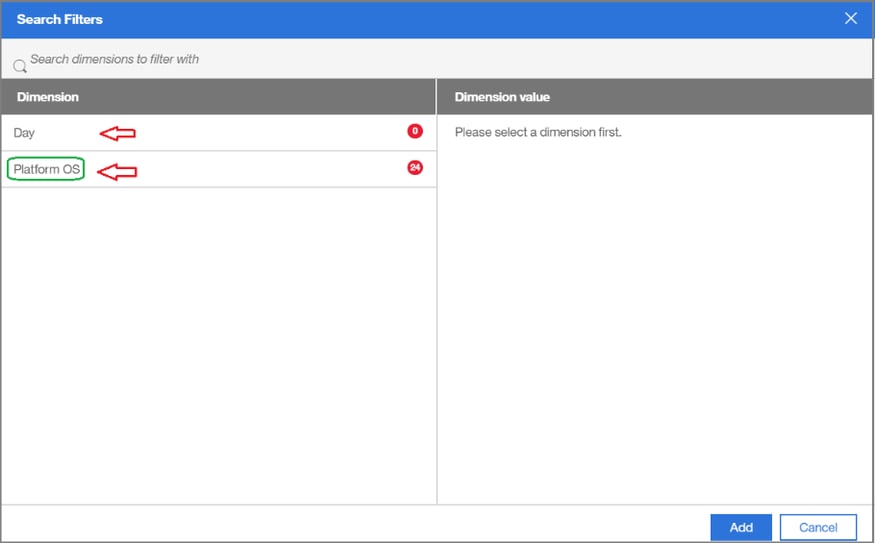
2. The Search Filters window will open where a list of available dimensions for the report is displayed. Click to select the dimension you want to filter. For our example, we will select Platform OS, as shown in green in the image below.
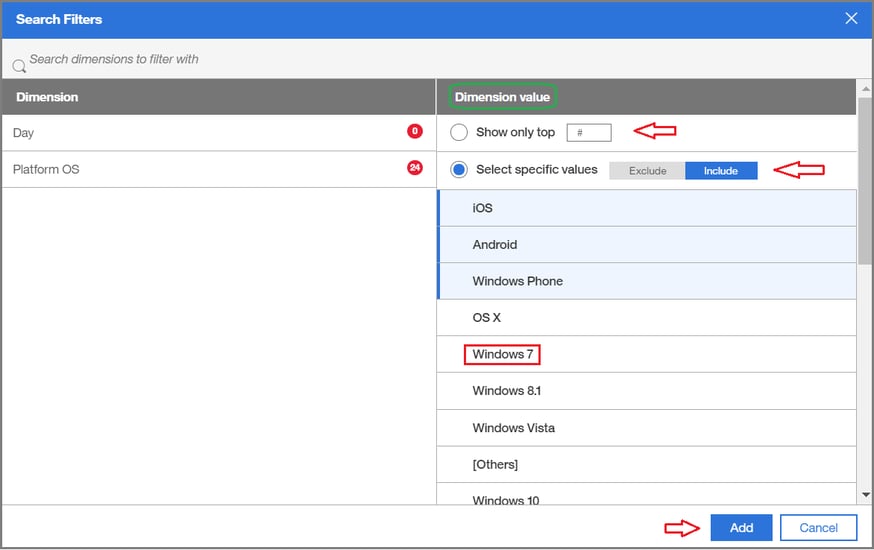
3. After clicking to select the dimension you want to filter, a list of options for dimension values will display on the right of the Search Filters window. As shown in the image below, you can select to filter dimensions to a specified number of values or select to edit the dimension filtering to include or exclude specific dimensions. For our example, we will select to filter the Platform OS dimension to also include Windows 7, as shown by the red box in the image below, and then click Add.
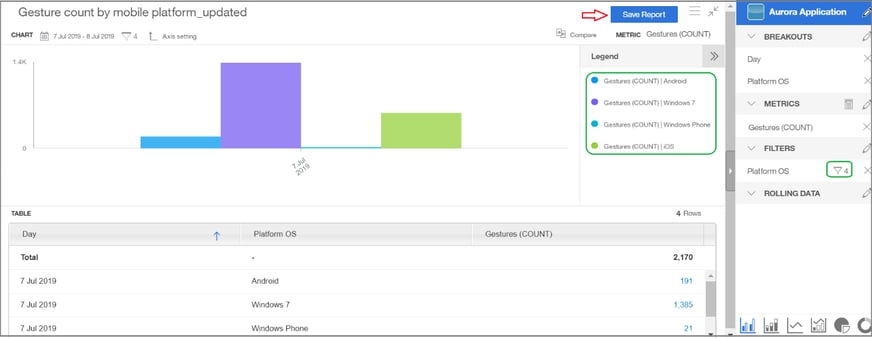
4. The report will then update to display the Gesture Count by Mobile Platform for the Platform OS for Window 7, as well as iOS, Android, Window Phone, as shown in the image below. The filtering will now show 4 filters applied to the Platform OS dimension, as shown by the green boxes in the image below. To save this updated report, click Save Report as shown by the red arrow.
Manage Data Ranges
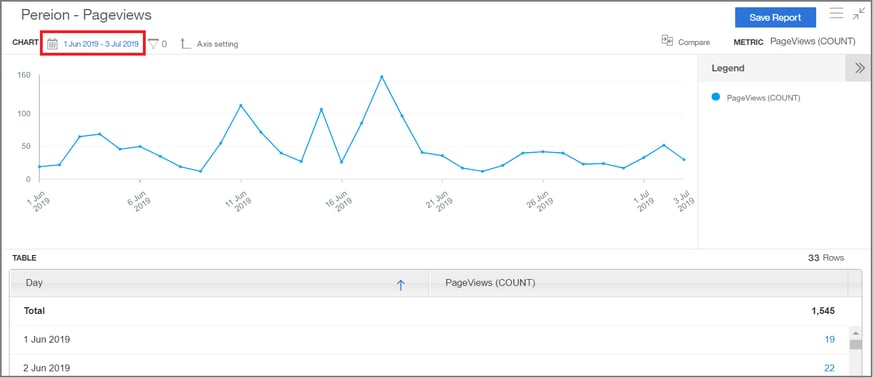
1. You can manage the date ranges for your standard reports by clicking in the upper left of your report, as shown by the red box in the image below.
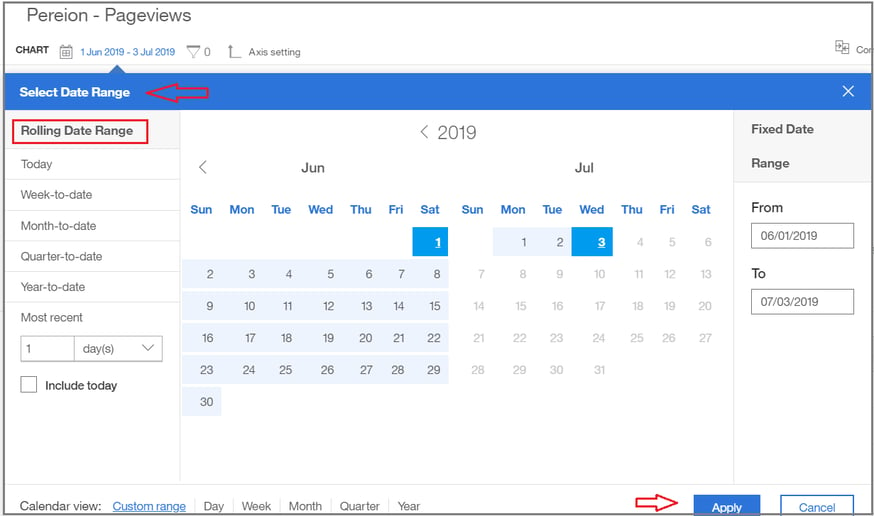
2. A Date Range box will open where you can make select an updated date range for your report including week-to-date views, month-to-date views, and more, as shown in the image below. After editing a date range, click Apply.
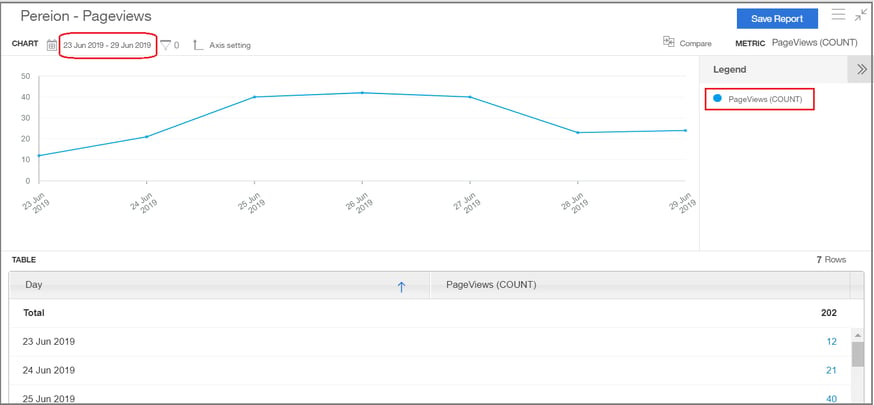
3. The view for the standard report will refresh to reflect the updated selection of data ranges. In our example below, we have updated the view for our Page Views (Count) to show the data for the last week only.
Set Up Dual Axis
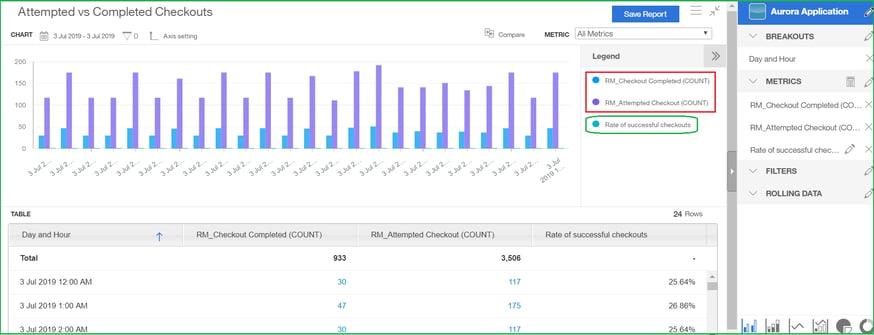
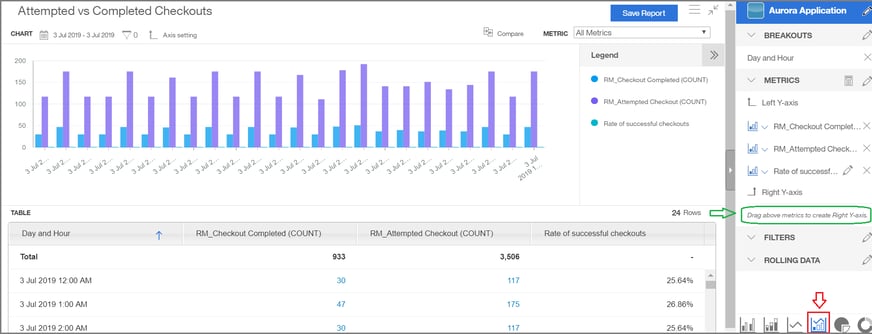
For some reporting, it can be helpful to apply a dual axis view of the report data. For example, in a report showing counts and an associated rate -- like in our report for Attempted vs Completed Checkouts shown below -- it can be helpful to see total counts side-by-side along with associated rates to give us more insights at a glance.
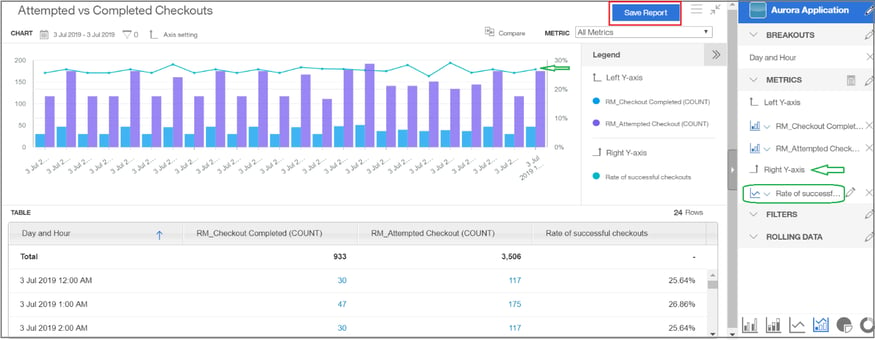
1. To set up a dual axis in a report, click the chart combo icon, as shown by the red box and arrow in the image below, to create a combo chart for the report, which adds an additional y-axis to the chart. You can then drag the appropriate metric(s) to create the Right Y-Axis, as shown by the green box and arrow below. For our example, we will drag our calculated “rate” metric (i.e. rate of completed checkouts to attempted checkouts) to the Right Y-Axis, as shown highlighted in green in the second image below.
2. The report view will refresh to display the attempted checkout (count) and completed checkout (count) as bars in the chart and the rate of these counts will be displayed as a line in the chart, as shown in the image below. Click Save Report in the upper right to save this updated report.
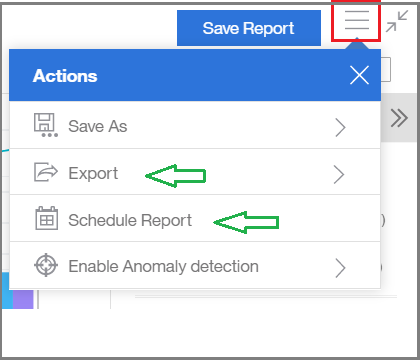
Export and Schedule Standard reports
1. You can select to export reports or schedule reports by clicking on the actions menu, as shown by the red box in the image below.
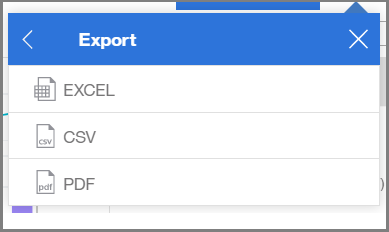
2. By clicking to export a report, you can then select a file format for the exported report, as shown in the image below.
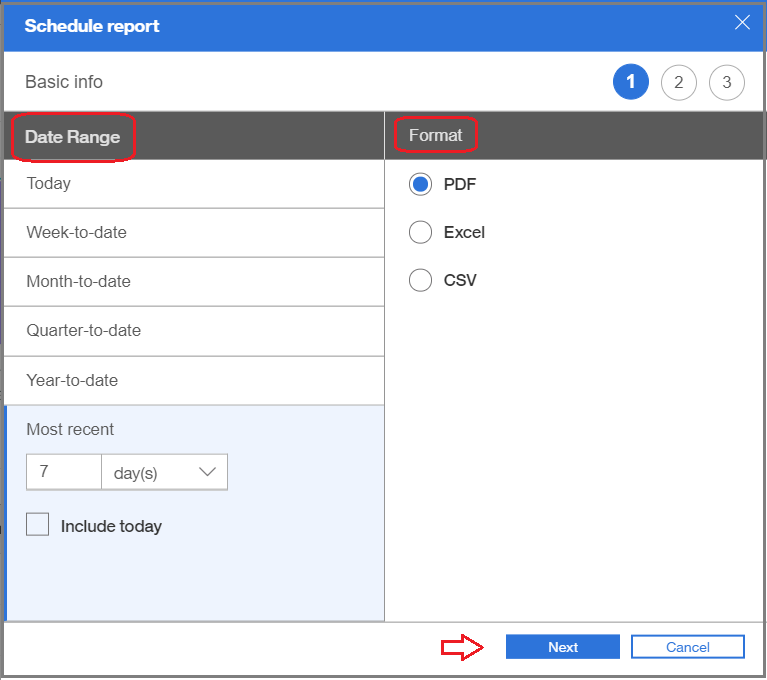
3. By clicking to schedule a report, a window will open where you can select the Date Range and Format for your scheduled report and then click Next, as shown in the image below.
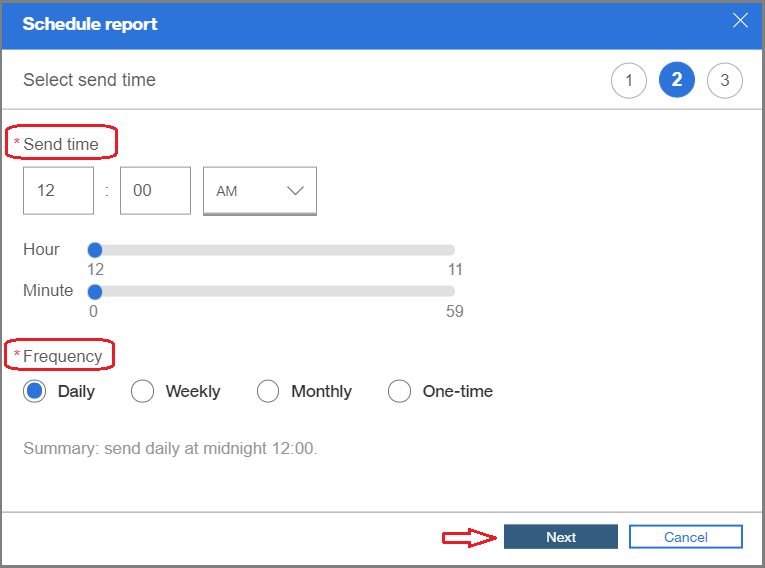
4. You can then select a send time and frequency for your scheduled report, as shown in the image below, and then click Next.
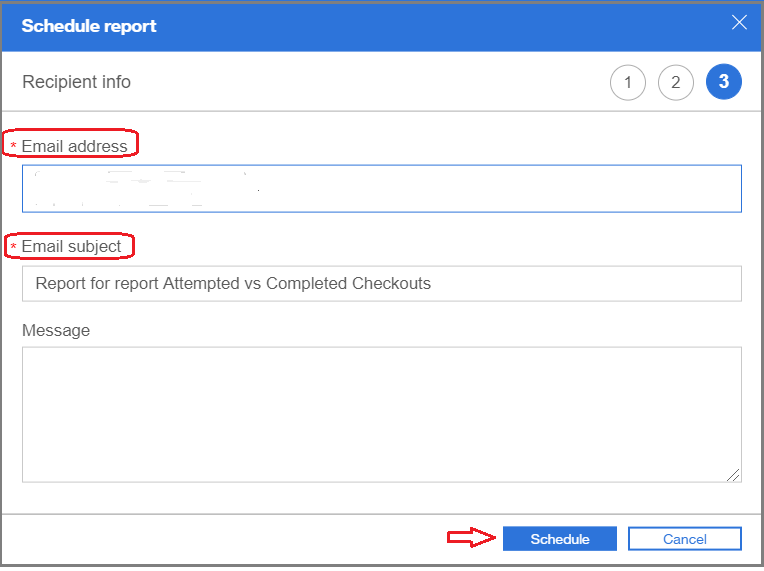
5. You can then enter the email address(es) of recipient(s) to receive the scheduled report, as well as update the email subject (if desired), and enter a message (optional) and then click Schedule, as shown in the image below.
Need more information? Request a consult with us for addition information or training topics by clicking here.
Click here to go back to the Tealeaf Fundamentals main page
