Introduction:
As an online business, you operate in a competitive and dynamic environment where it is critical to closely monitor many key performance indicators – and readily identify any anomalies with your business. At the same time, it is imperative that you quickly understand the root cause of the issues and gain the necessary business intelligence to rapidly respond to evolving challenges and optimize your online business.
Analysis Overview:
By enabling Anomaly Detection for key metric reports, you can leverage the power of predictive analytics to detect unusual patterns, or outliers, in your customer behavior data, recognize potential contributing factors and apply session analysis to readily identify issues and gain the actionable insights needed to take corrective actions.
Analysis Benefits:
Analysis Formula:
This customer experience analytics (CXA) formula will explain how to enable Anomaly Detection on important metrics you want to monitor for unusual patterns or anomalies in your business using Watson Customer Experience Analytics (CXA), and then use the anomaly detection data to recognize contributing factors for outliers. We will also highlight how session analysis can be used to drill deeper to better understand the root cause of any issues, offering the opportunity to take corrective actions to curtail further incidents.
How anomaly detection works
At least 14 days’ worth of data for specified metrics is required for Anomaly Detection. For the metrics specified, Anomaly Detection loads historical data, calculates the model and the anomaly points, and ranks the contributing factors for the anomaly. The anomaly information is then presented in a separate Anomaly Detection data view in the metrics report. Anomaly detection reports are calculated only once per day. So, depending on timing for the anomaly, there may be a one day delay in its notification and being able to analyze the anomaly data.
Consider the metrics you want to closely monitor for anomalies
As anomaly detection can be very useful in identifying outliers that could signal potential issues – like a spike or drop in site traffic, a fall in transactions or revenue, or unexpected behavior patterns that may be relative to fraud or system errors – you will want to consider enabling Anomaly Detection on your key metric reports that monitor events important to your site and business performance. Metric reports that track checkouts, cart abandonments, or registration/log in attempts, for example, are good considerations for anomaly detection.
Helpful Tip: When selecting a metric for Anomaly Detection, you will get more value if you select something more specific, for example: sessions from affiliate partners versus overall session count (that could be too broad.) The challenge with a broad metric is that different trends/changes may cover or cancel each other. So, for example, if you have a big drop in the organic traffic and, at the same time, you have a significant increase of affiliate generated traffic – an anomaly won’t be detected, as long as the overall session count remains the same.
Enable Anomaly Detection on report metrics
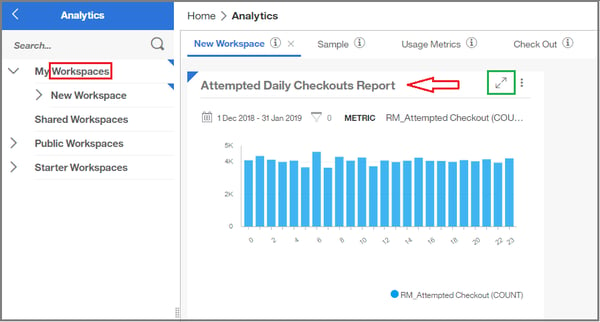
1. From a workspace, select the report on which you want to enable Anomaly Detection. In the example below, we have selected an “Attempted Daily Checkouts Report.”
 Select a report from a workspace on which to enable Anomaly Detection
2. Open the report by clicking the “expand” icon in the upper right, as shown in green in the example above.
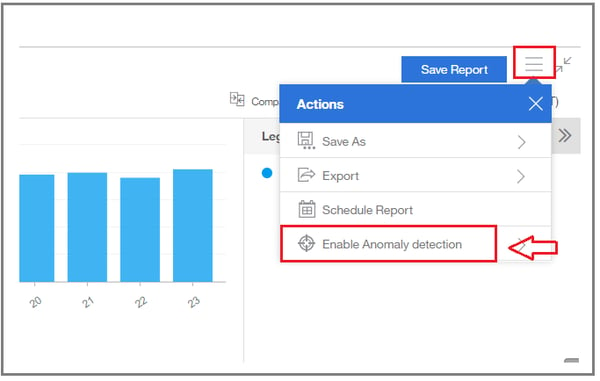
3. From the open report, click the Hamburger menu in the upper right and then select Enable Anomaly Detection from the Actions menu, as shown below.
 Select to enable Anomaly detection from the Actions menu
4. Select the metrics on which to apply Anomaly detection, as shown below.
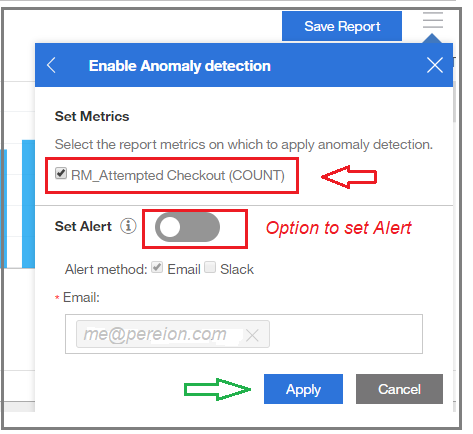
a. Optional: Enable the Alert feature, select the alert method, and enter email of additional alert recipients. To use Slack as an alert method, you must configure Slack integration on the Company Settings page. You can use the Alert Manager to manage and modify Anomaly detection alerts.
b. Click Apply, as shown in image above.
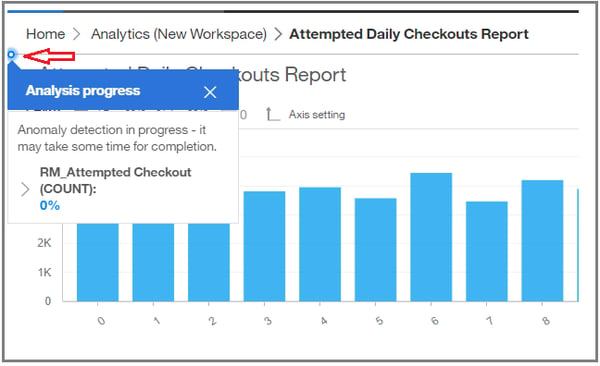
A blue dot indicator is displayed at the top of the report, showing the progress of Anomaly Detection as it is applied to the metric, as shown in the example below.
 A blue dot indicator moves across the top of the report showing progress of the Anomaly Detection Report
Note: It can take some time for Anomaly Detection to collect historical data and to calculate data deviations for the specified metric. In most cases, for the initial Anomaly Detection calculations, data is made available in ten to thirty minutes. After the initial calculations, the system just needs to calculate for the new dates, and that takes less time.
When Anomaly Detection is fully applied to the metric, the progress indicator disappears and a View by option is added to the report interface in the upper right, as shown in example below.
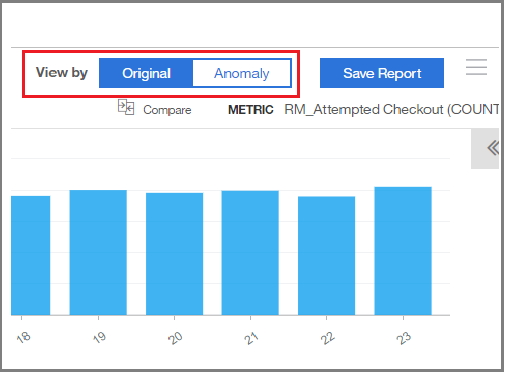
5. Select View by > Anomaly in the upper right to open the report in the Anomaly Detection view, as shown below.
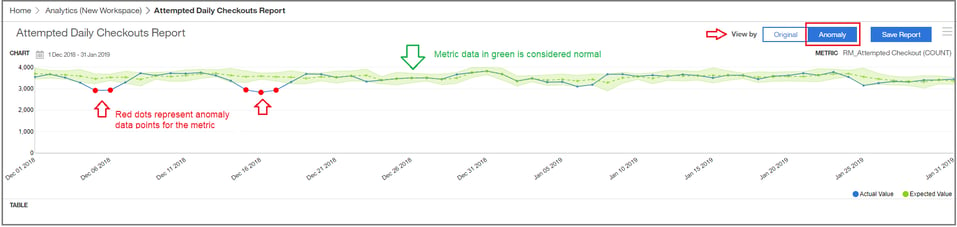
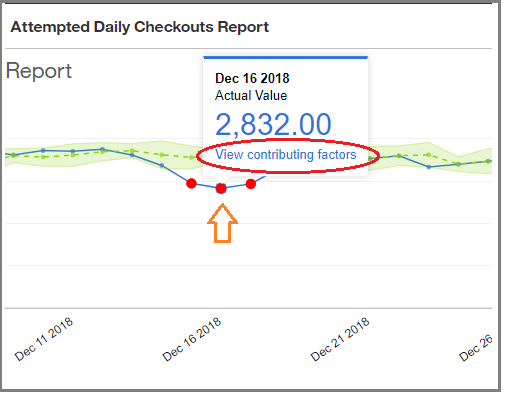
A table in the chart will populate with information about contributing factors, as shown below. You can also click to view sessions from the table of contributing factors, as shown with a red arrow below, offering you a valuable macro to micro view into root causes of potential issues on your site.
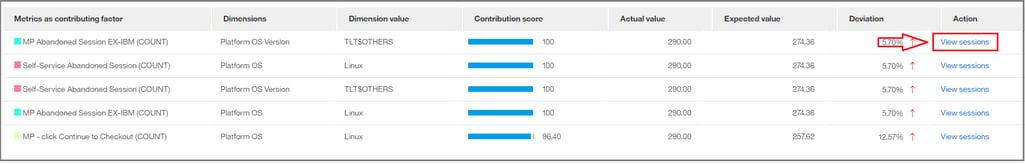 Contributing factors for the anomaly are identified in a table with a link to view sessions for more in-depth information on potential issues
Note: Contributing factors are in-fact correlated factors. So, the changes in their variables do occur at the same time and in the similar magnitude as for the analyzed metric. But, that does not always mean that the identified contributing factors are the cause of the anomaly.
Augmenting your critical metric reports with anomaly detection metrics boosts your business intelligence by providing real-time, actionable insights you can use to discover unexpected incidents and quickly respond to evolving and complex issues – offering important use cases like detection of fraud, intrusion, system errors and more – and the opportunity to optimize your online business performance.
Need more information? Request a consult with us by clicking here.
Click here to go back to the Tealeaf on Cloud Use Case Formulas for Success main page
