Introduction:
Customers today have come to consistently expect optimal online experiences. Deliver anything less and you run the risk of not converting a user or potentially losing a loyal customer. A crucial first step in the process of optimizing your customer experiences is your ability to quickly discover, understand and minimize customer struggle on your site.
Analysis Overview:
By utilizing Struggle Analytics, a a cognitive feature in IBM® Tealeaf® Customer Experience on Cloud (Tealeaf CX on Cloud), you can easily monitor specific processes or promotional pages on your site to quickly identify customer struggle and uncover areas of opportunity to improve and optimize your customer experiences.
Analysis Benefits:
Analysis Formula:
This customer experience analytics (CXA) formula will explain how to use Struggle Analytics in Tealeaf CX on Cloud to effectively monitor specific processes, pages and events on your site for struggle activity, allowing you to quickly detect and analyze customer struggles and take corrective action to rectify issues and deliver frictionless customer experiences.
How Struggle Analytics work:
Struggle Analytics is a cognitive feature that uses algorithms to learn over time what is normal user behavior on a page and what is not and assigns a struggle score based on struggle factors. The struggle score is calculated from weighted default factors and struggle event factors, and factors are weighed on a scale of 1 to 10.
By default, struggle factors for events in Tealeaf CX on Cloud are calculated for a page URL or screen based on the following core attributes:
A. Repeat pattern – repeated patterns of unproductive user actions
B. Step count – number of user-initiated actions on a page such as clicks and entering text
C. Load time for page in seconds
D. UI element -- detect issues with UI elements, such as a user repeatedly clicking an icon
Note: There is also the option to add user-defined events as struggle factors, allowing you to closely monitor and weight variables that are specific to your particular business. Elements to consider could include abandonment events, error pages, no results searches, or events that capture struggle for customers in a particular region, etc.
Consider the pages you want to analyze for customer struggle
Customer struggle can vary depending on your site design or business focus, but some examples of struggles you may want to monitor could include users entering multiple credit card numbers (i.e. potential fraudulent activity) on your check out page, struggling with a form field (i.e. user confusion) on your registration page or having to wait extended periods of time for a page to load (i.e. poor or invalid web design) on your product page or shopping cart page.
Configure Struggle Analytics for your application
1. Map pages and prepare application for analysis
a. Select Struggle Analytics in Tealeaf CX on Cloud from right navigation, and then from the Options menu in the upper right corner select Map Page, as shown in images below.
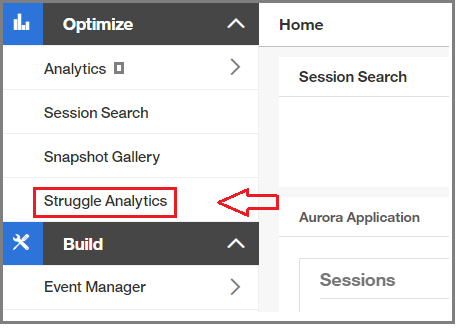
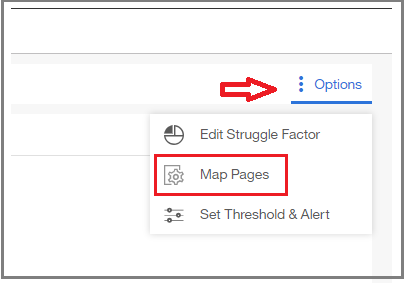
Navigate to Struggle Analytics From upper right, select Options then Map pages
b. The Page Mapping configuration window will open where you can enter a recognizable name for your mapped page or use the provided preconfigured page names and icons to name your pages. In example below, the Log in page has been selected for mapping.
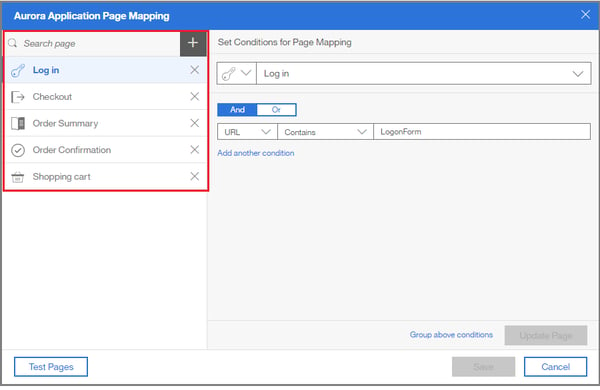
Configure your page or event from the page mapping window
c. Then enter the page URL you want to monitor and select the appropriate conditions you want to include for your page mapping. The conditions that you specify can be And or OR and are based on the page URL or an Event, as shown in the images below.
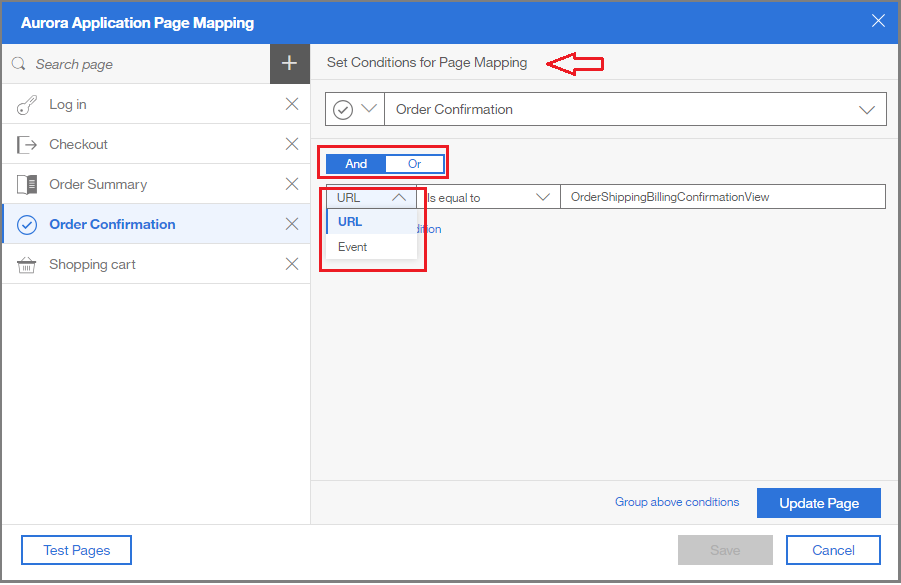
Specified conditions can be AND or OR and based on a URL or Event
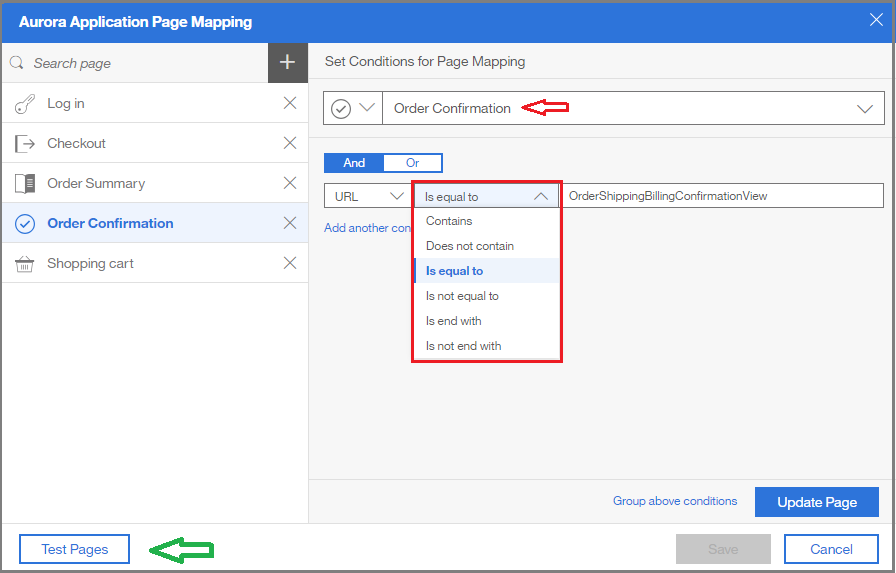
Select appropriate conditions to be included for page mapping and test pages
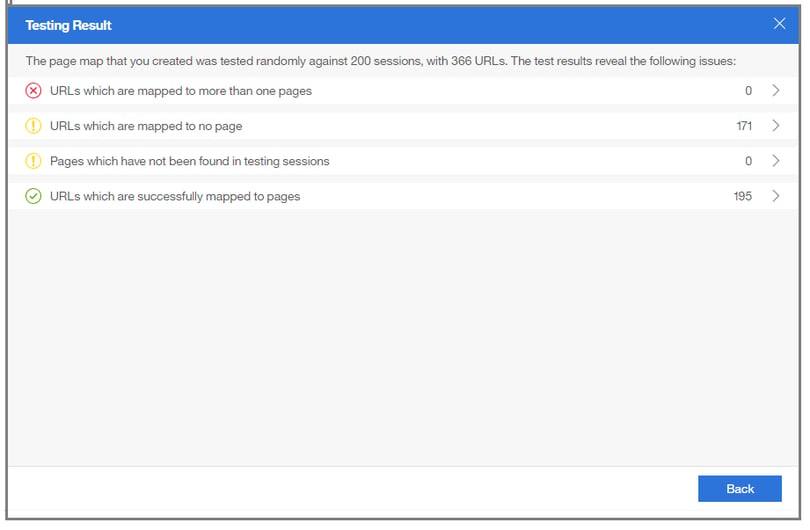
d. Test the set conditions against existing sessions by selecting Test Pages in the lower left, as shown by the green arrow above. Then, resolve any issues that are shown in the Test results window, as shown in image below.
When all of your page maps have been added and tested, the Struggle Analytics service will begin to analyze customer struggle in sessions for the mapped application. It takes about 10 minutes for the Struggle Analytics service in Tealeaf CX on Cloud to begin posting results. The generated struggle report will identify customer struggle for your mapped pages using a set of algorithms based on key struggle factors and a struggle score will be assigned.
Modify the default configuration for Struggle Factors
Struggle Analytics provides a predefined configuration for load time, step count, repeat pattern and UI element struggle factors. However, Tealeaf CX on Cloud allows you the option to modify the configuration for struggle factors that are taken into consideration in the algorithm. You can change the weight (significance/importance) of a factor, add event-based factors, or exclude a struggle factor from being calculated on a particular page. The ability to modify the configuration for Struggle Factors is helpful if you want to shift your focus to a particular area as your analysis becomes more specific over time.
2. Modify configuration for struggle factors:
a. Click Options in the upper right corner
b. Select Edit Struggle Factor from the menu
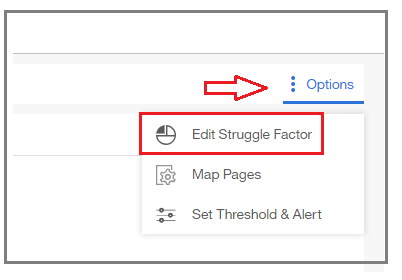 Navigate to edit Struggle Factors
c. The associated Default Factors and Struggle Event Factors are displayed.
i. Adjust the struggle factor weight by sliding the circle left to right, as shown by red arrows in image below.
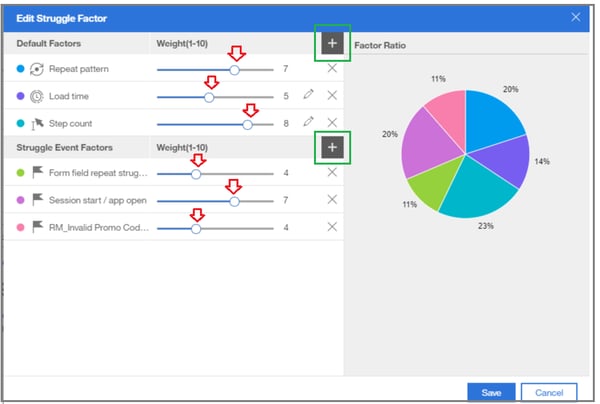 Edit Struggle Factor for Struggle Analytics
ii. Add an UI element factor by clicking on the plus sign “+” next to Default Factors, and add an event-based factor by clicking the plus sign “+” next to Struggle Event Factors, as shown with green boxes in the image above.
iii. Placing your cursor over sections of the pie chart will display pertinent factor ratio information, as shown in the image below.
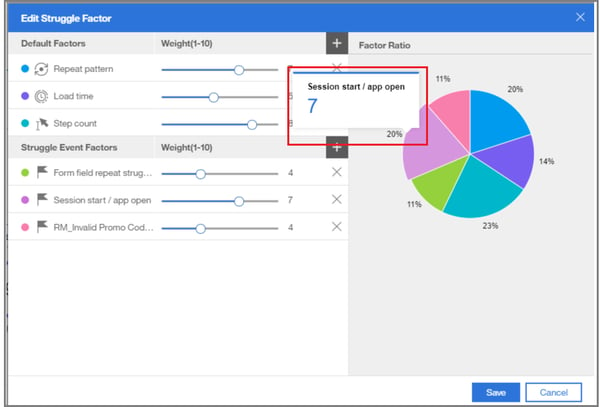
iv. Click Save in the lower right to save your struggle factor selections.
Modify the configuration for Struggle Thresholds
You have the option in Struggle Analytics to edit the configuration for Struggle Thresholds, allowing you to make modifications to struggle thresholds that are most relevant to business on your site.
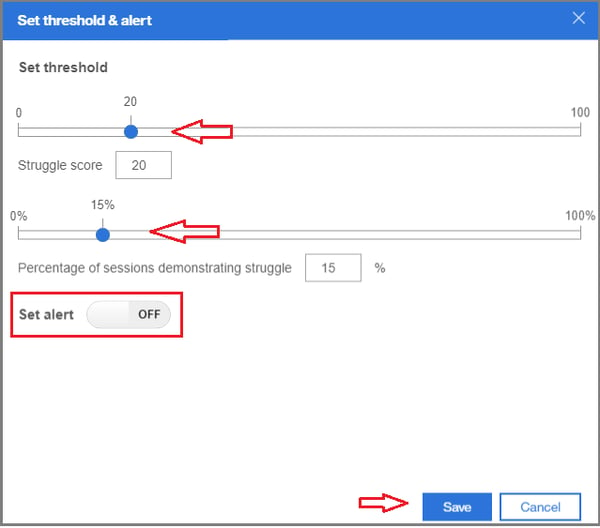
For example, in the screenshot below, the struggle score threshold is set to 80 and the Percentage of sessions demonstrating struggle is set to 5%. If you have enabled the option to receive alerts, an alert will be sent if and when it is detected that 5% of the sessions are showing a struggle score of 80 or more.
3. Modify the configuration for Struggle Threshold
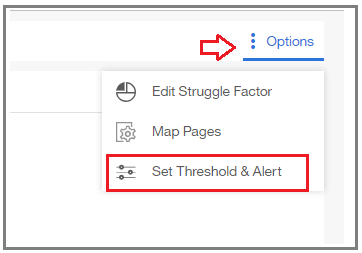
a. Click Options in the upper right
b. Select Set Threshold & Alert from the menu, as shown below.
 Navigate to set struggle thresholds and alerts
c. As shown in the image below, the configuration screen will appear where you can:
a. Edit the struggle score threshold
b. Adjust the percentage of sessions demonstrating struggle
c. Enable alerts (optional) to be notified when thresholds are exceeded. (See our Tealeaf CX on Cloud Use Case formula for Real-time Alerting for more details on setting alerts.)
d. Click to save your edits
 Set struggle thresholds and enable alerts
Understand and Use the Struggle Analytics Data
The reports generated by Struggle Analytics display the sessions that match the page mapping conditions and struggle score and percentage that you set. Highlighted are the top 10 struggling sessions, the session struggle score, and the session struggle indicators and number of instances of each struggle indicator, as shown in images below. From the details page, you can view the median load time, step count, and UI element struggle for the struggling page or event.
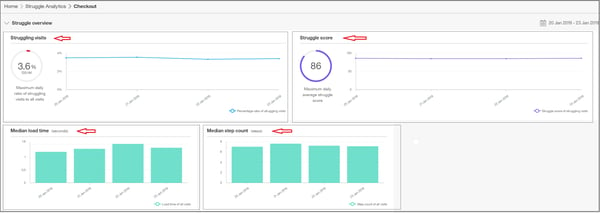 Overview of Struggle scores and conditions
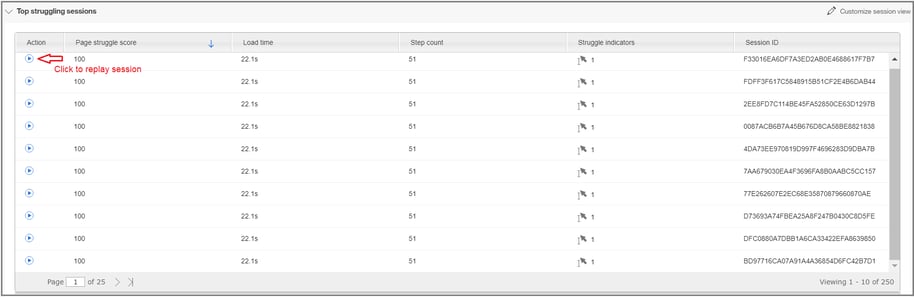
Report of top struggling sessions with ability to replay sessions to view the actual struggle
Utilizing session replay technology in Tealeaf CX on Cloud, you can then drill deeper and replay the sessions that included struggle activity and view the actual struggle, allowing you to easily identify the source of struggle and take quick action to rectify issues and optimize the customer experience on your site.
Need more information? Request a consult with us by clicking here.
Click here to go back to the Tealeaf on Cloud Use Case Formulas for Success main page.
