Introduction:
Offering an optimized customer experience requires more than just providing your online customers with enhanced web pages or advanced site functions -- it requires you to ensure that your entire online business process is optimized and nurtures conversions. As customers progress through various process steps to complete transactions on your site, it is important to monitor your critical business processes and identify and alleviate customer friction within individual process steps. Understanding where your customers may struggle within your business process offers you the opportunity to optimize your process steps, enrich customer experiences and improve conversions.
Analysis Overview:
By using process reports in IBM® Tealeaf® Customer Experience on Cloud (Tealeaf CX on Cloud), you can gain visibility into the overall performance of your business processes and identify individual process steps that may require enhancements or improvements. By then comparing the performance of process steps across a common process flow for different segments of your business, you can recognize segments that may require increased refinements and optimization.
Analysis Benefits:
Analysis Formula:
This customer experience analytics (CXA) formula will explain how you can:
Create process reports for your critical business processes
Online business processes differ, but common examples include placing an order for a product on your ecommerce site or registering a new user account for your business. Similarly, the process steps and sequence of events can vary and may include the following: place items in a shopping cart, provide customer information and shipping address, complete payment method, review order and submit order for fulfillment. The events that follow the placement of a customer order are key in your overall business process as well and can include: processing payments, verification of orders and shipment of the final products and more.
As such, you will want to ensure you have events built to record the important process steps that make up the sequence of events that define the flow of your critical business processes.
1. Create a process report using the Report feature in Tealeaf CX on Cloud
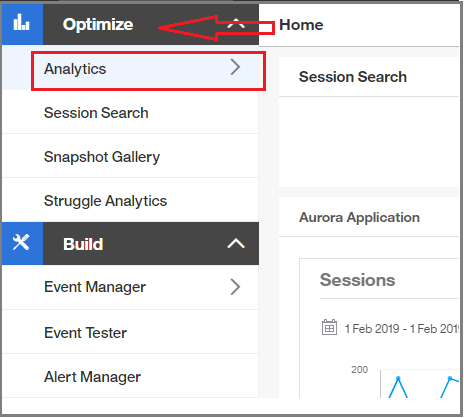
a. Under Optimize on the left navigation, select Analytics to go to your workspace, as shown below.
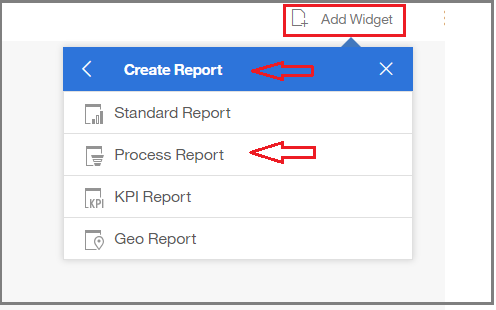
b. From the upper right of the screen, select Add widget and select Create Report > Process report from the Actions menu, as shown below.
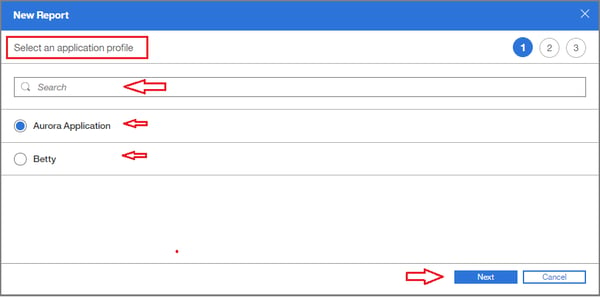
c. The New Process Report page is displayed where you can select an application profile and click Next, as shown below.
d. The Select metrics as step page will display, as shown in image below.
e. Select the steps that define your business process, as shown below.
i. From the Metrics column, select the events that when sequenced together define the process that you want to score or evaluate.
ii. Drag each object one at a time a time to the Steps column. The metrics are linked together in a sequential process flow in the Steps column.
iii. For each step you select, the absolute numbers of visitors are counted, and a conversion rate is calculated.
f. Enter a step name for each metric you added to the Steps column and click Next.
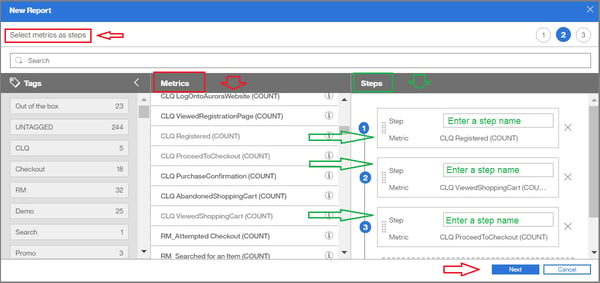 “Select metrics as steps” page where you can select the process steps to evaluate
g. Select any additional segments or use the default segment only, as shown below, and click Create to preview your Process report.
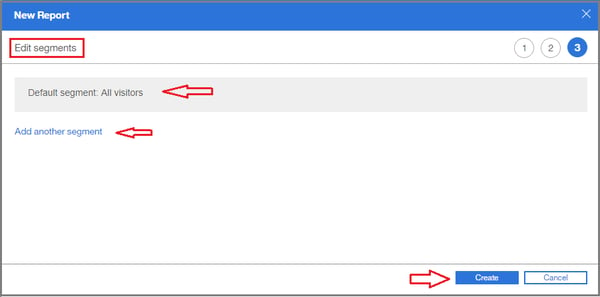
h. Finally, click Save report to create the report and add it to your workspace, as shown below.
 If you are satisfied with the process report, you click to save it to your workspace
2. Evaluate your Process Report to understand how the steps in your business process are performing.
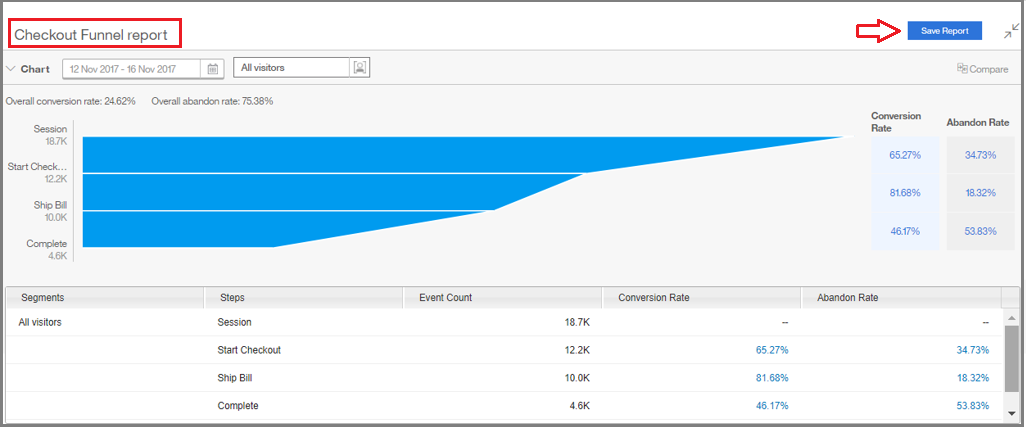
a. Process reports automatically measure and score (against defined goals) the overall success and failure of your online process steps. As an example, see image below to view the conversion (success) and failure (abandonment) rates in a Checkout Funnel process report with the process steps of Start Checkout, Ship Bill and Complete.
b. Analyzing the scoring for each process step allows you to easily identify process steps that include a percentage of abandonments that fall outside expected or typical percentages for your business.
 Evaluate performance of your important process steps using a Process Report
Ongoing monitoring of your process report is important and can help you identify significant changes in performance across your business processes that might signal a concern, allowing you to quickly rectify issues and keep your business processes and customer experiences optimized.
Drill deeper to understand what causes abandonments
By identifying process steps that reflect a higher than normal percentage of abandonments, you have the ability to analyze sessions to better understand the cause of customer friction or struggle within the process step(s). For example, if your process step for “Check Out” is showing a high percentage of abandonments, you can drill down into sessions to understand if customers may be entering expired promotion codes or an invalid payment type. Or, if you have added a new step to your registration process, and abandonments are high for the new process step, you can use session analysis to understand if customers may be confused on the new step or if there may be an issue with your registration form or field. As a streamlined and frictionless business process is key to creating loyal customers and boosting conversions, it is important to quickly identify and understand what obstacles may prevent customers from successfully progressing through your business process steps with optimized experiences.
Compare segments for a better understanding of your overall business process performance
Comparing your process reports for different segments allows you to look at how your various segments are performing across a common business process flow or how your data from process reports may change over a period of time by comparing different dates. By comparing process reports, you are able to identify individual segments that encounter challenges in your business process steps and then apply improvements to increase conversions across your entire business process.
For example, you can compare a process report for all mobile visitors and a process report for all desktop web visitors to determine if a segment encounters a struggle in a particular process step. If your mobile visitors struggle during a particular process step, while your desktop visitors do not, you can then drill down further to understand what is causing friction for your mobile visitors. Perhaps one of your process steps is not optimized for mobile? Or, are your mobile abandonments isolated to a particular operating system? You can also compare segments to understand if customers struggle in a particular geography or if customers encounter friction while using a particular browser across your business process.
1. Compare process reports for different segments or dates
There are a couple of ways you can compare process reports in Tealeaf CX on Cloud
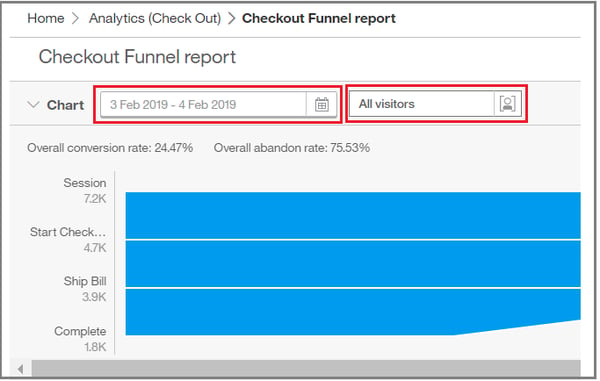
First, you can update the audience view or date view when viewing a process report.
a) While viewing a process report from your workspace, click the audience or date boxes in the upper left corner to switch your audience view or date range view, as shown below.
b) The process report will refresh to reflect the data for the updated audience or date
Or, you can compare process reports for different audiences or dates for a common process flow in a side by side comparison view.
a) From your workspace Open the Process report for which you want to compare data, select the Compare link from the upper right corner, as shown in the first image below. The Compare mode screen is displayed where you can select to compare by date or segment, as shown in the second image below.
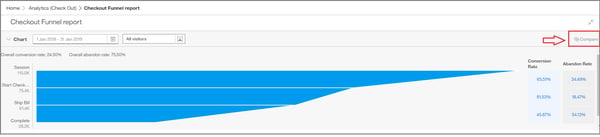 Click the “Compare” link in the upper right to compare process reports
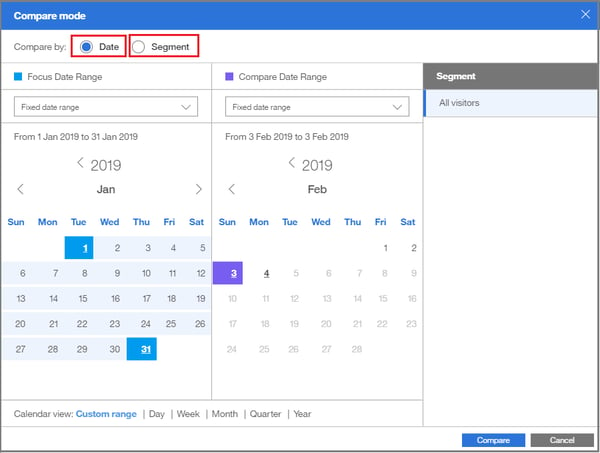 Select to compare by Date or Segment from the “Compare mode” screen
b) Enter the compare criteria. You can compare by date or by segment, as shown above.
i. Enter the date or segment for the current report and enter the dates or segments for the comparison report.
ii. Select Apply to apply your criteria to the report.
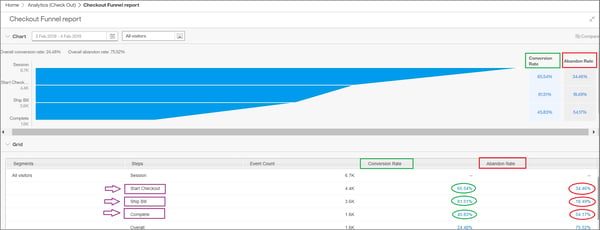
iii. The original report and the report with the new date or segment are shown side by side for comparison, and the data is viewable in chart or grid form, as shown below.
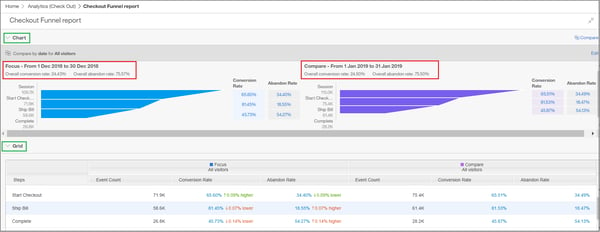 Side by side comparison of process reports for a common process across different dates
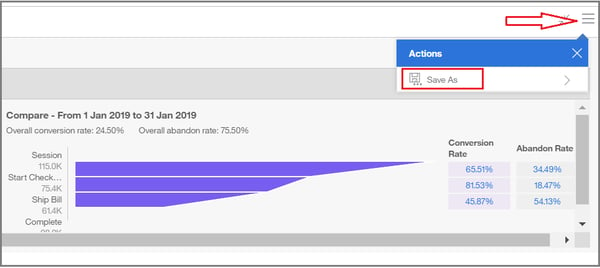
c) Select Save as from the Actions menu in the upper right to save the report to your workspace and enter a name for the report, as shown below.
2. Analyze the comparison data across the process reports
Comparing the performance of process steps for different segments across a common process flow allows you to easily recognize customer struggles for a distinct segment and understand if a particular segment is impacting your business process success. With this increased insight, you have the ability to make improvements that will increase conversions and the success of your business process across all segments
By creating process reports, you are able to look at the performance of your overall business process and understand where you may be losing customers in your process, providing you the opportunity to optimize your process steps to improve the customer experience and boost conversions.
Need more information? Request a consult with us by clicking here.
Click here to go back to the Tealeaf on Cloud Use Case Formulas for Success main page
