Introduction:
Developing a complete view of your customers is critical in today’s competitive environment where it is essential to understand how customers are interacting with your business and why particular customer behaviors may be recognized on your site. By expanding your reach with geospatial analytics available in IBM® Tealeaf® Customer Experience on Cloud (Tealeaf CX on Cloud), you can now also understand where geographically customers are engaging or struggling with your organization, allowing you additional insight to make more informed and targeted decisions about your business on a global level.
Analysis Overview:
By applying geo analytics to your reports, you can understand how your business is performing across geographical areas, allowing you to identify particular areas that may require improvement or adjustments and overall enabling you to maximize wide-scale business opportunities.
Analysis Benefits:
Geospatial analysis can be applied to many use cases to help identify geographical areas for improvement and assist with targeting key areas to maximize potential opportunities. Some business examples could include:
Analysis Formula:
This customer experience analytics (CXA) formula will assist you with applying geo analytics to event reporting available in Tealeaf CX on Cloud to understand how your business is performing across states, regions or the globe. At the same time, the formula will illustrate how to set a threshold to measure geo analytics data by positive or negative performance, as well as drill down into particular sessions, as appropriate, to visualize customer experiences for increased optimization.
This analysis is flexible and you should apply geo analytics to the event reports that are most important to your business goals or most relevant to your key performance indicators (KPIs).
Create a Geo report to begin to evaluate your data from a geographical view
Just as events populate reports, the Geo reports populate event data based on the location of a customer’s device or machine.
1) To create a Geo report, navigate to the Event Manager to either build an event or modify an existing event for geo analytics.
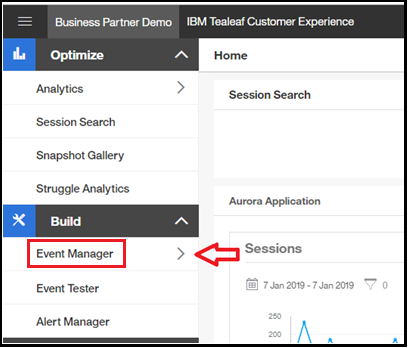 Navigate to Event Manager
a) The event you build or the event you select to modify will depend, of course, on what data you want to evaluate on a geographical level. Any event that you would like to evaluate on a geographical level can be created or modified for geo analysis.
b) Looking at our example scenarios, you could build or modify an existing event tracking hits to particular website pages or to marketing landing pages you may have developed to support a campaign. Or, you could create or select an existing event tracking mobile interactions on your site or build an event to record online abandonments, as examples.
2) Once you have created an event or selected an event to modify, you can enable the event to collect geo analytic data by simply scrolling to the bottom of the event’s configuration, and then selecting the ON switch for Geo Analytics.
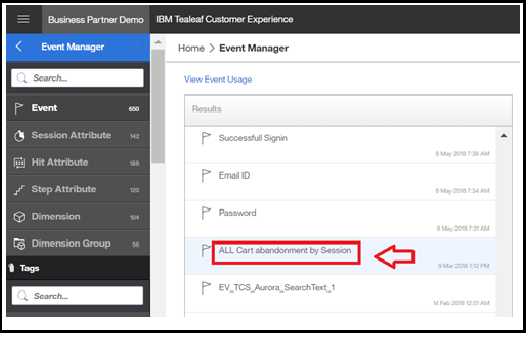 Create a new event or select an existing event to modify (as shown above)
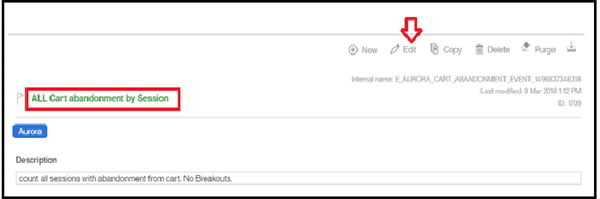 Click "Edit" in upper right to view the event's configuration (see above) and then scroll to bottom of event's configuration to select the ON switch for Geo Analytics (see below)
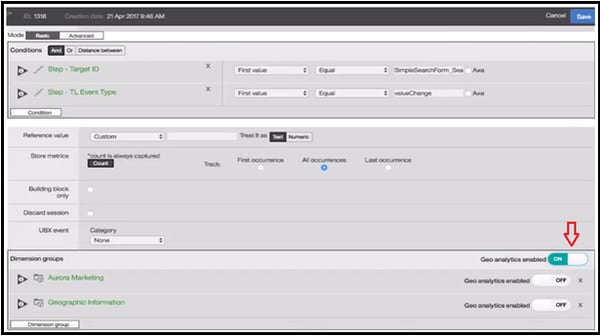 Geo analytics reporting enable for selected event
a) When the geo analytic-enabled event is saved, you can use the event in geo analytic reports OR in standard reports using geo analytics as breakout values.
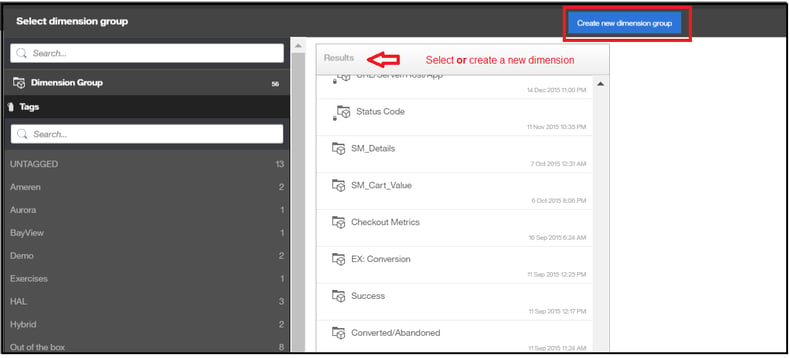
b) Similarly, you can also enable dimensions for geo-analytics and integrate the dimensions as a breakout in a report.
c) Using the Geo out of the box dimension groups, you can segment report data by continent, country, state or city.
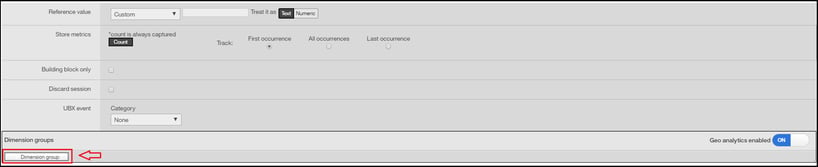 Enable dimensions in geo-analytics to segment your report data by audience, unique location or any other refined classifications by selecting “Dimension group” (see above) and choosing from available dimensions or creating a new dimension (see below) to meet your reporting requirements.
3) From an open Workspace, select “Add Widget” and select “Create Report.” From there, select “Geo report,” as shown below.
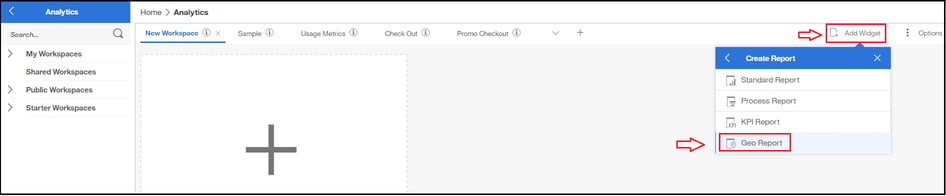
The Geo Report screen will appear and a map of the world will be displayed, as shown below, and configuration options are available in the upper left.
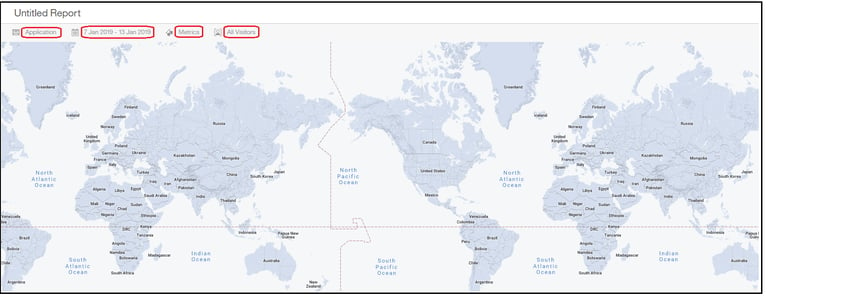
a) From the upper left of the Geo report screen, first select an application’s profile. You could be monitoring both a mobile application and a desktop website for your business, for example.
b) Next, select a timeframe to populate report data from. You can select a fixed data range OR select to keep your report updated with rolling date ranges, as well as filter the data by dimension groups that are defined and enabled for the metrics that you select.
c) Then, select “metrics” and you will be given the option to “add metrics” or “create calculated metrics” as shown below.
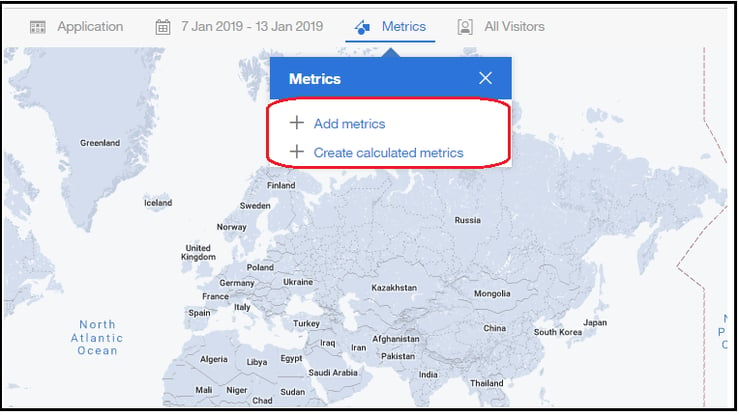
As Geo reports can be populated by multiple metrics, you can select the metric or metrics to be used in your report
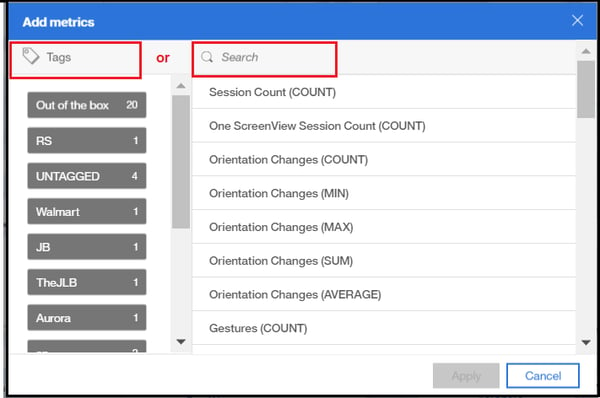
i) If you click to “add metrics,” you can select the metric by filtering by the tag that was assigned to the metric OR select the metric by using Search, as shown below. For example, in the first use case on examining online abandonment rates by state, you could search by the word “abandonment” and then select the applicable event that was created to capture abandonments in reporting.
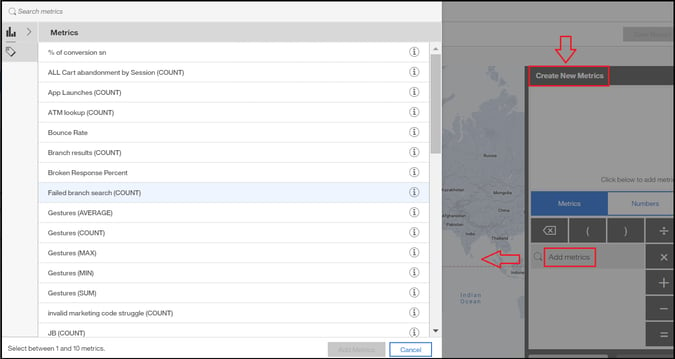
ii) If you click to “create calculated metrics,” a “create new metrics” calculator will appear. By clicking “add metrics,” a list of available metrics you can use in your calculation will appear, as shown below. You can then use the functions on the calculator to create a valid formula.
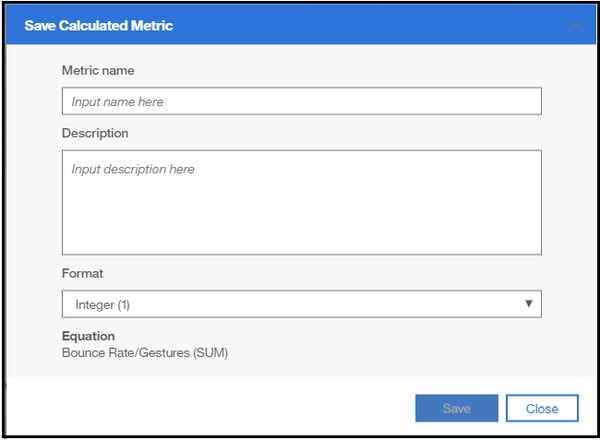
Once a valid formula is created, a “Save calculated metric” dialog box will open, as shown below, where you can enter a name, description and format before clicking to save the calculated metric.
d) Once the Geo report is configured – with application, date range and metrics selected -- the map of the world is displayed and areas of event performance are identified as dots on the Geo report. You can select to view the data by continent, country, state (as shown below) or city.
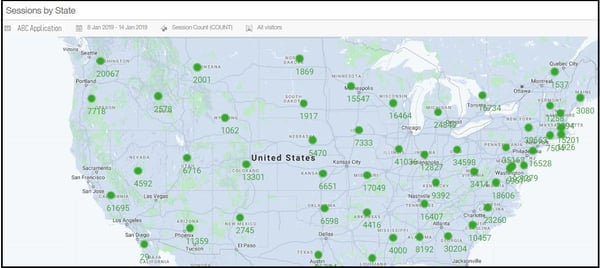 Geo report identifying session counts by state
Apply thresholds to identify negative and positive event performance in Geo reports
Geo reports can track both positive and negative performances of events. To identify positive and negative events in the Geo report, you can set a threshold to analyze geo analytics data. The threshold value determines at what value we establish the geo report as positive (or healthy) or establish the geo report as negative (or critical.)
1) From the displayed Geo report, you can select the “summary” tab from the upper right. A dashboard appears showing the “average” value of the mapped data, as well as the highest value and lowest value of the mapped data.
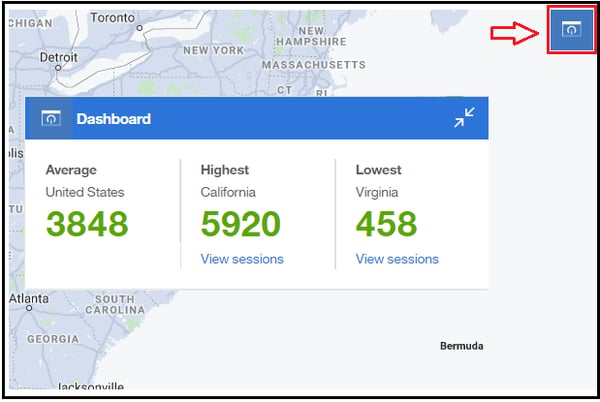 Summary dashboard of mapped data
2) After reviewing the dashboard data, select the “threshold” indicator in the lower left, as shown below. From the threshold indicator box, you can select to measure a positive performance or select to measure a negative performance. Again, if we were using our example of abandonment rates by state, we would select to measure a negative performance, as we are populating our Geo report to track abandonments.
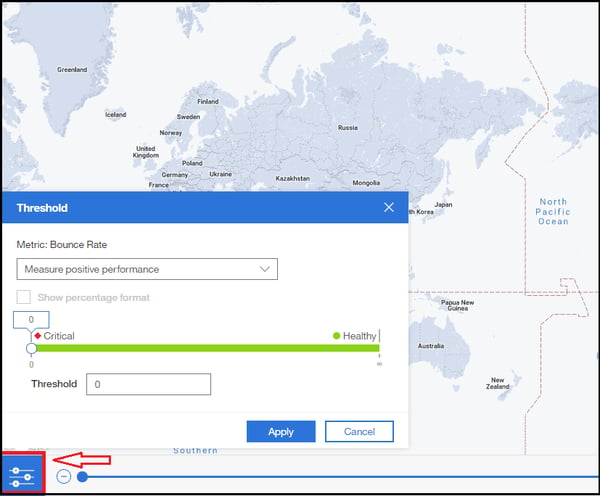 Click the threshold indicator to display the threshold indicator box
3) Insert the threshold value to be used in your Geo reporting.
a) While you can select any value for your threshold, it is helpful to consider the data in the summary dashboard when selecting your threshold value. For example, if we again refer to our first use case, if the state with the highest rate of online abandonments includes 660 abandonments, we could use half of that number, or 330, to start out as our threshold indicator.
b) You should consider KPI’s and performance goals assigned to your business when selecting the appropriate threshold value to include in your Geo reports.
4) After applying the threshold value, the Geo report is updated to reflect positive or healthy performance in green, as shown below. When numbers exceed the defined threshold, the numbers are displayed in red for negative or critical performance.
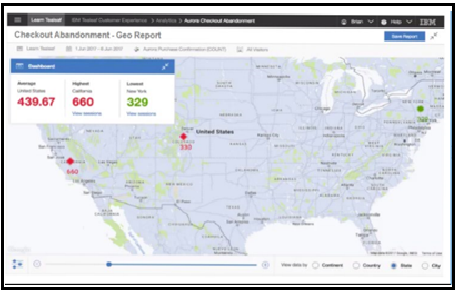 Geo report with threshold values applied
5) Select Save Report to save the report to your workspace and enter a name for the report.
a) The ability to view data in a Geo report allows you to quickly understand how business goals are performing across geographical areas and to easily identify geographies, regions, states or even cities where your business may require improvements, adjustments or enhancements.
i) Did your campaign landing pages show critical performance in one or two countries compared to healthy performance reflected in 5 or 6 additional countries? What contributed to the poor performance in particular countries?
b) Using replay capabilities available in Tealeaf CX on Cloud, you can drill down into sessions from areas where a critical performance is identified in the Geo report and visualize what struggles or obstacles may be contributing to the negative results.
ii) Were campaign landing pages slow to load in critical performing countries? Did a design flaw on the landing page cause customers to struggle? Geospatial analysis complemented with replay capabilities in Tealeaf CX on Cloud can help you identify poor performance in select geographical areas and assist with visibility into the necessary improvements.
Geospatial analytics offers additional insight into your data and helps you better understand how your business is performing across countries, regions, states and even cities. The observations from Geo reports can help you realize how promotional campaigns, render times, abandonments and more measure up across the globe, allowing you to reach beyond transactional data into locational information that can identify geographic trends and assist with making better business decisions to maximize global opportunities.
Need more information? Request a consult with us by clicking here.
Click here to go back to the Tealeaf on Cloud Use Case Formulas for Success main page.
