Introduction
With the extensive growth of marketing channels and disparate data sources, it can be challenging to understand your customers’ complete journeys and difficult to secure valuable digital intelligence from your customers’ actions. However, the ability to gain actionable insight from the paths and behaviors of your customers can provide you with a competitive advantage – allowing you to uncover areas of conversion struggle and to identify opportunities to increase business.
Analysis Overview
By using IBM Universal Behavior Exchange (UBX), you can easily share customer data between UBX-enabled products, including IBM Digital Analytics and Watson Customer Experience Analytics (CXA), to quickly broaden your understanding of your customers’ behaviors and visualize the entire customer journey, allowing you to identify top-performing paths, compare revenue and customer values across unique segments, and resolve potential issues to increase conversions.
Analysis Benefits
- Utilize UBX’s simple browser-based user interface to quickly and easily define the data exchange between UBX-enabled products that you already own without the expense, delay and complication of custom integrations.
- Solve problems within a shared customer context by seamlessly combining customer behavior data from unique solutions into a comprehensive view.
- Seamlessly connect customer data sources to facilitate a consolidated view of customer journeys that allows you to recognize the most traveled paths, the shortest paths, the paths that generate the most revenue and the paths that are the most successful in leading to conversions.
How does UBX work?
UBX syndicates data in real-time from endpoints. The data syndicated includes events (which capture a single customer behavior) and audiences (which are segments or groups of customers.) Endpoints are the solutions that send data through UBX, and they syndicate data through UBX as Publishers, Destinations, or both. Publishers register and send events and audience information to UBX, while the Destination endpoints, or Subcribers, register and receive events and audiences.
Each customer event that enters the UBX system can come from a different channel or data source and can use different ways to identify the customer. The UBX identity service determines where those identities overlap, allowing individual seemingly separate events to be understood as the actions of a single customer.
As UBX receives customer events, it attempts to join the incoming identifiers with the identifiers that exist in its identity database. Overtime, the UBX identity service joins unique identifier information that might be common across multiple applications that you define as UBX endpoints in the same user account. The result provides the continuous and evolving view of the customer in multiple context.
Analysis Formula
This customer experience analytics (CXA) formula will assist you with setting up IBM DA customer data in UBX to pass over within Watson CXA, allowing for the selective exchange of event, audience and identity data between the applications, to offer a consolidated view of the customers’ journeys and a deeper understanding of your customers and their behaviors.
For our CXA formula example, we will consider the following scenario: IBM DA as the Publisher, IBM Customer Experience Analytics as the Subscriber, Entry Page as the Event, and Page View Tag as the website tag.
Note: While this example features the IBM Digital Analytics and IBM Customer Experience Analytics solutions, any UBX-enabled products can be registered in UBX including various IBM, IBM Business Partner, third party solutions and your own internal applications.
To get started with accessing UBX:
- If you are already in the IBM Marketing Cloud using IBM Digital Analytics (DA) or using another qualified IBM commerce application, simply fill out a form to request access to IBM UBX. You will receive a log in and password to access the cloud based UBX system.
- If you are an IBM Business Partner and want to take advantage of UBX, register or sign in to IBM PartnerWorld. You will need to be an independent software vendor (ISV) to get started.
1. Verify your event type is supported in UBX
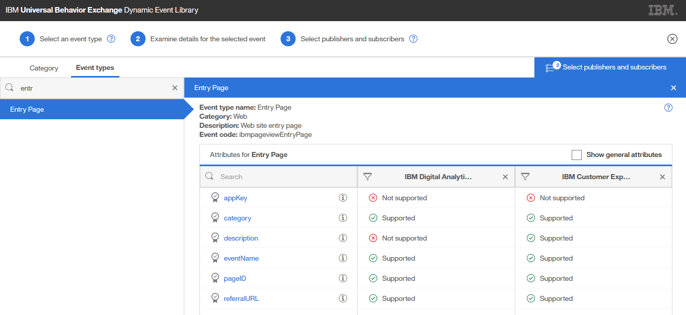
Before getting started with registering your endpoints, use the Dynamic Event Library in UBX to verify that the event type you will want to use for your particular business use case is supported in UBX. Dynamic Event Library can also be used to determine which UBX partners publish or subcribe to specific event types.
To get started with Dynamic Event library:
- Go to top left Hamburger menu
- From the menu, select “Dynamic Event Library” which will open in a new tab
- In top right, select “Select Publishers and Subscribers"
- Set “IBM Digital Analytics as the Publisher,” as IBM Digital Analytics data will be passed through UBX in this example.
- Select “IBM Customer Experience Analytics” as the Subscriber.
- As UBX is an open system, there are many endpoints that can be registered in UBX, including IBM Campaign, Demand Side Platforms (DSP), Demand Management Platforms (DMP) and more.
- Select the event type. Per our example, select “Entry Page.” (See screenshot example below.)
- Verify that event is supported by the Publisher and Subscriber
2. Register endpoints in UBX
As endpoints are the solutions that send data through UBX, you will need to register the appropriate endpoints in UBX for use in your UBX account. For our example, IBM Digital Analytics will be registered as a Publisher in UBX and IBM Customer Experience Analytics as a Subscriber.
To register a new endpoint, do the following:
- On the Endpoints tab, click “Register new endpoint.” The endpoint registration wizard will display.
- Note: The Endpoint registration wizard lists UBX endpoints for products and solutions that have completed an evaluation process and provide a way for you to submit your access credentials. You can filter the list by endpoint provider. If the endpoint that you want to register does not appear on the list, you must register it as a custom endpoint.
- Select the endpoint that you want to register and click “Next.” For our example, select “IBM Digital Analytics” as a publisher, and “IBM Customer Experience Analytics” as a subscriber.
- Provide the information that the endpoint provider requires as part of the registration request (i.e. information about your organization and UBX account is required to proceed with the registration process.) When you have finished entering the information, click “Next.”
- If you entered registration information into the registration wizard, UBX transmits the information to the endpoint provider so that the provider can complete the registration. The endpoint displays on the Endpoints tab as “Pending” until IBM and the endpoint provider completes the registration and then the status changes to “Active.”
3. Subscribe to Events
When you log into UBX for the first time, you will have no event subscriptions. To subscribe to Events, do the following:
- From the Events tab, click “Subscribe to events.”
- Select “IBM Digital Analytics” to subscribe to events from this application.
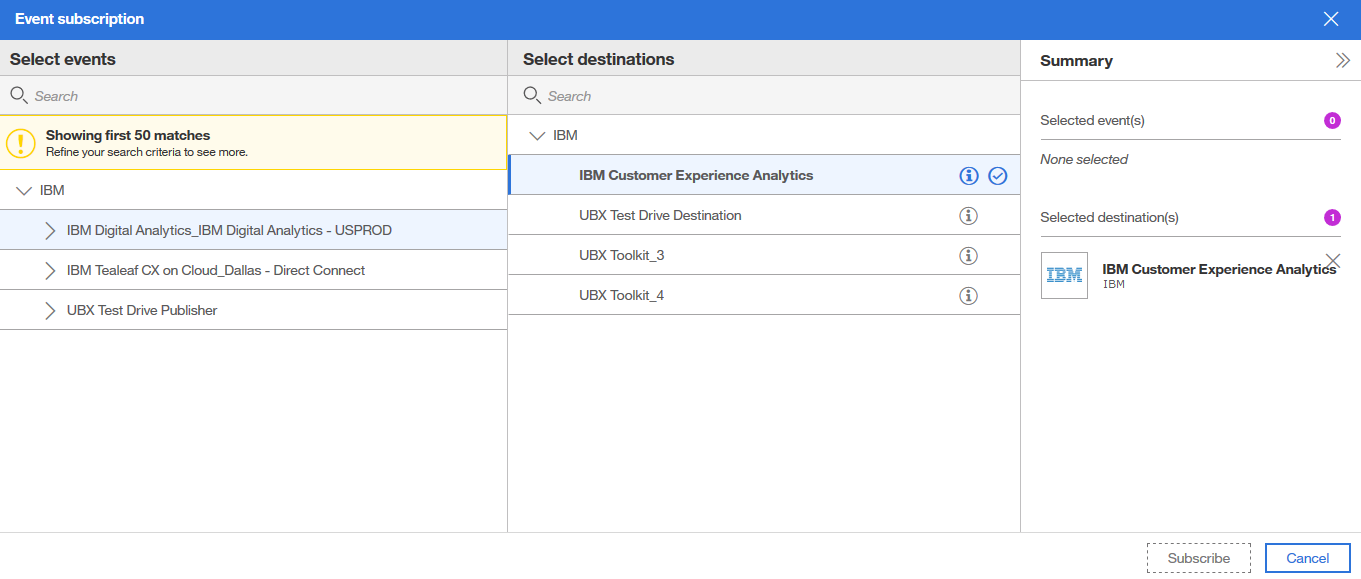
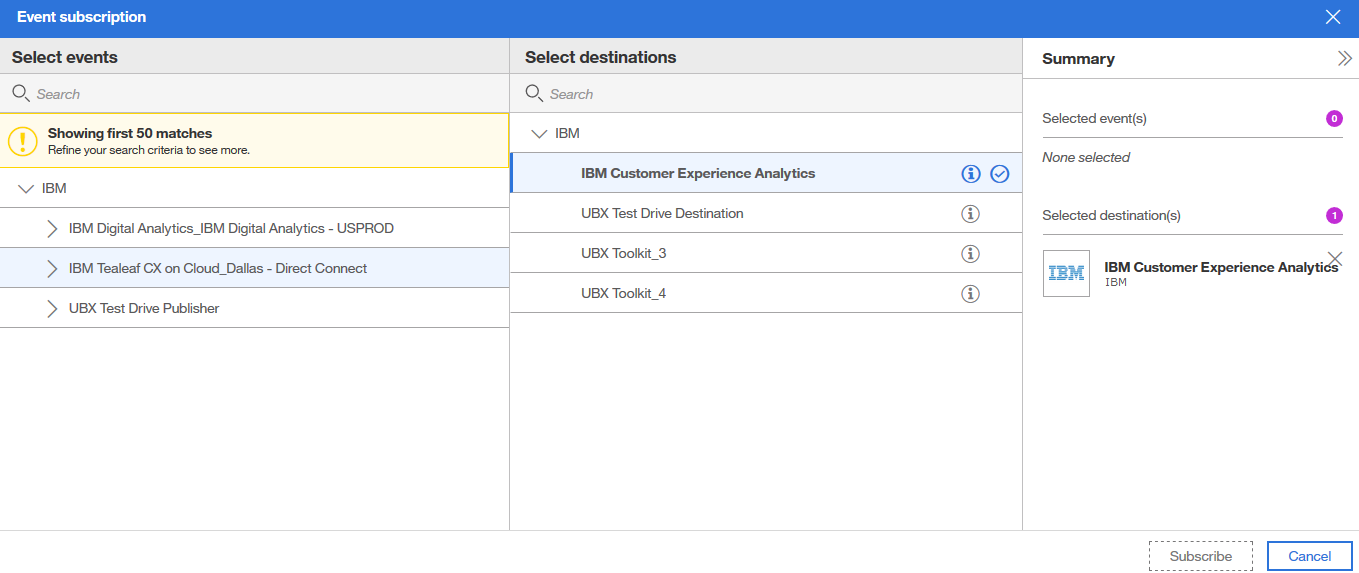
When subscribing to Events in UBX you will need to select your Publisher and Destination
C. From the list of available events, select the one or more relevant events you want to send. For our example, select “Entry Page.” (See screenshot example below.)
D. Next, you will need to select the destination for the event(s.) Under “Select Destination,” select “IBM Customer Experience Analytics” for our example.
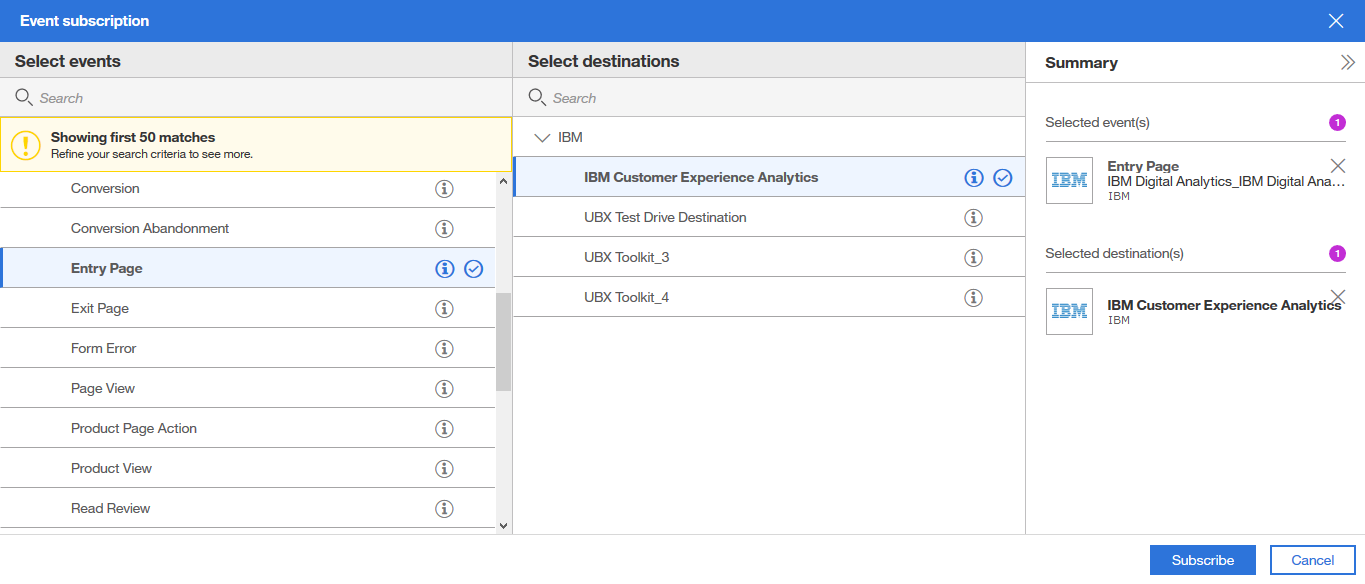
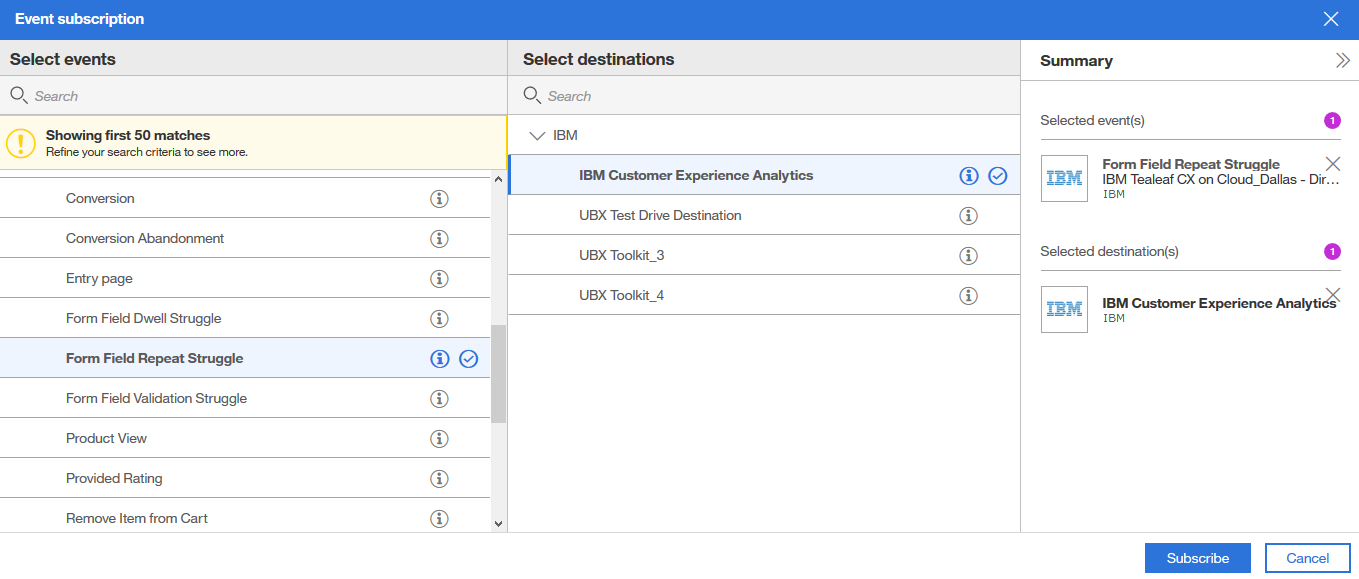
Select the one or more relevant events you want to send when subscribing to events in UBX
E. Click “Subscribe.” The publisher and destination will now appear in the Events tab.
4. Ensure website tag is enabled
- Ensure “Page View Tag” was set up during the initial IBM DA tagging on your website, as we are using Entry Page as our event for this example.
5. Create Journey Report in Watson CXA
To create a journey report in Watson CXA to visualize the customer journeys for your business, proceed through the following steps:
- From the navigation panel in Watson CXA, click Create > Journey report.
- From the Audience menu of the report builder panel, click the Edit icon to select an audience, or accept the default value of All customers.
- In the Interactions menu, click the Starting or Ending icon, or click one of the touch points on the page to add an interaction. Then, select an interaction to associate with the touch point.
- Accept the default date range to report on or you may click Modify to change it.
- While optional, you can add one or more filter conditions to the event by doing the following:
- Click Add filter and select an event attribute and operator from the lists.
- Enter a value to filter on. If you want to add another filter criterion, click +.
- Select the filtering logic that you want to use from the list at the top of the window and then click Apply:
- Satisfy all belowapplies AND logic to the filter processing where events must meet all of the listed filter conditions to be included in the results.
- Satisfy any belowapplies OR logic to the filter processing where events that meet any of the listed filter conditions are included in the results.
- Then, click Apply to add the interaction to the report configuration.
- Note: If you want to define another interaction, repeat the process of selecting an interaction, date range and filter conditions (if applicable.)
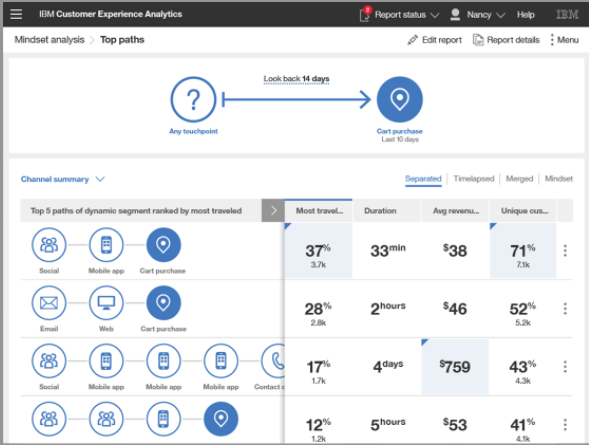
- In the Look period menu, you can specify the number of days in the range or accept the default range of 14 days.
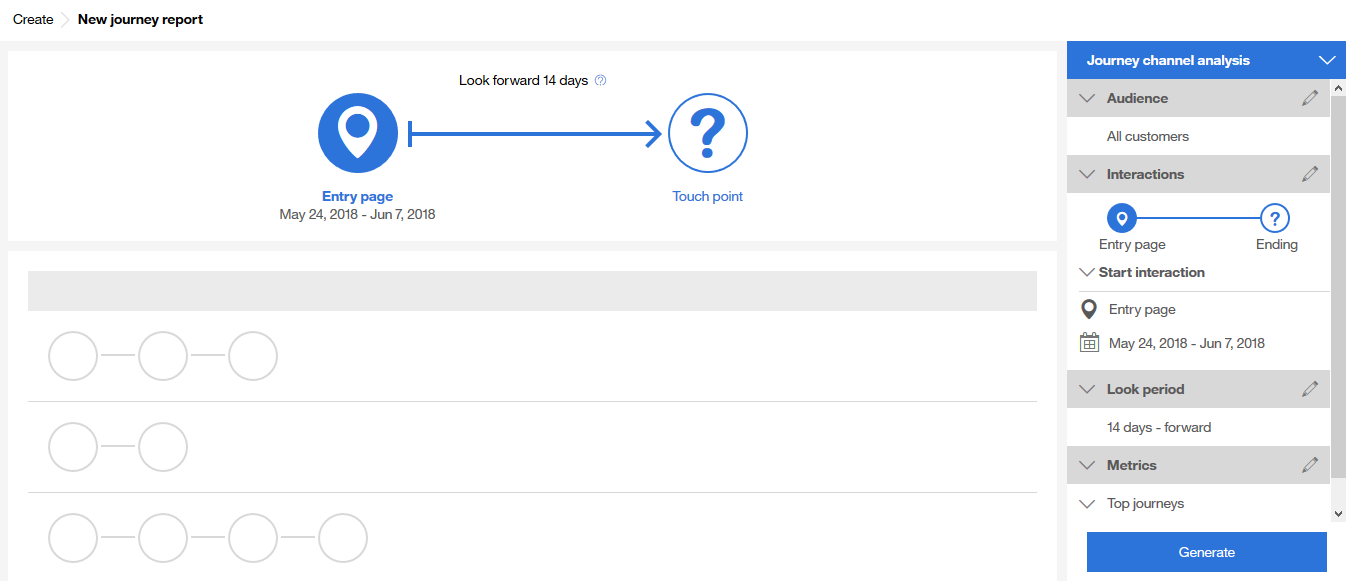
Journey reports allows you to specify the number of days in your desired look period
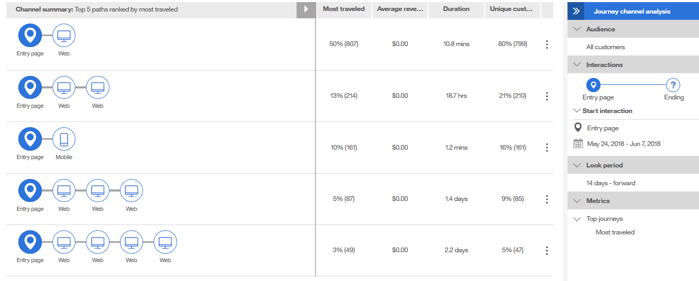
Journey channel summary showing the top 5 paths ranked by the most traveled
The ability to combine key customer data and gain a comprehensive view into your customers’ journeys and behaviors provides you with valuable customer insight you can use to identify struggle, optimize experiences and boost conversions for your business.
If you missed our last CXA Formula and would like help on how to set up Tealeaf CX on Cloud data in UBX, please access the CXA Formula, “Setting up Tealeaf CX on Cloud Data to Pass through IBM Universal Behavior Exchange (UBX)” by clicking here.


.png?width=690&name=dynamic%20event%20library-2%20(1).png)