The performance module of the Acoustic Experience Analytics UI Capture library can be configured to include a multitude of page performance metrics. These metrics can provide useful insights into your site’s technical performance.
To capture optional performance metrics, add them to the module the UIC and set their filters to ‘false.’
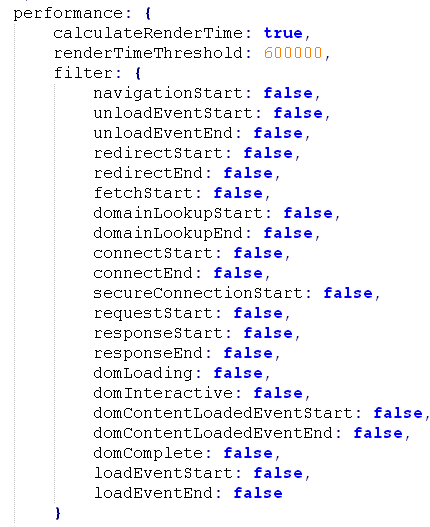
These performance options correspond to the available options of the W3C navigation timing specification. For more information, see http://www.w3.org/TR/navigation-timing/#sec-navigation-timing-interface.
More detailed documentation on UIC configuration can be found in the UI Capture reference: https://developer.goacoustic.com/acoustic-exp-analytics/docs/ui-capture-reference.
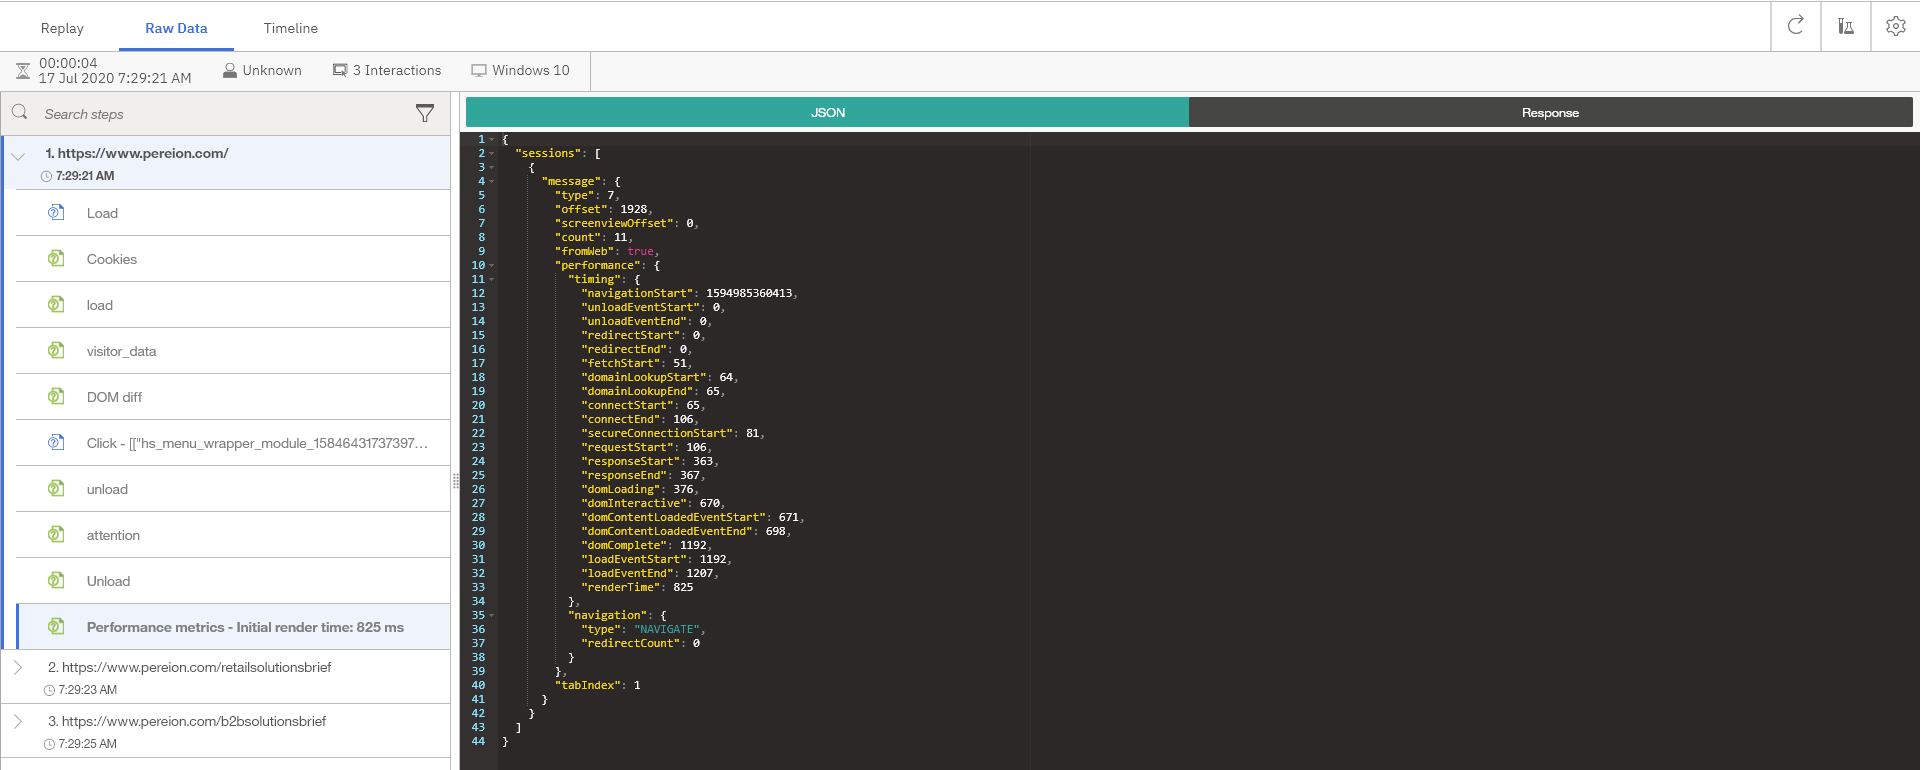
One configured, the metrics are visible in the Raw Data tab of session replay:
In order to track and report on the performance metrics, events must be configured in the Event Manager.
To start, create step attributes for each performance metric. The simplest way is to right click the name of the metric, then click ‘Create Step Attribute.’
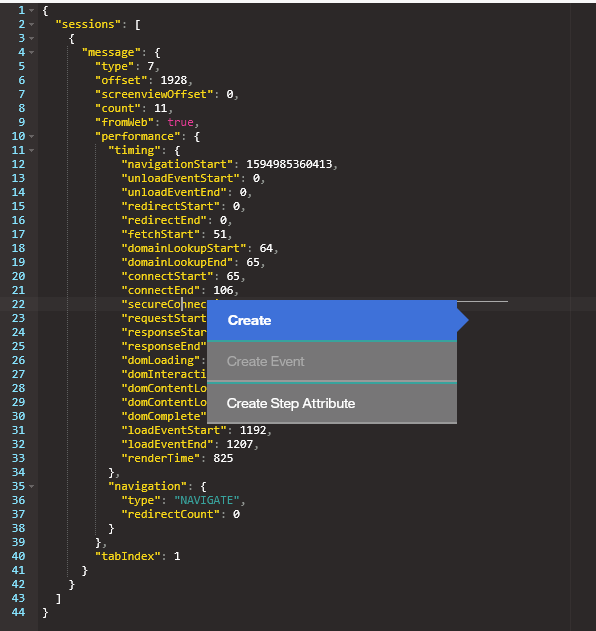
If ‘Create Step Attribute’ is grayed out, that means that the step attribute is already configured in the event manager.
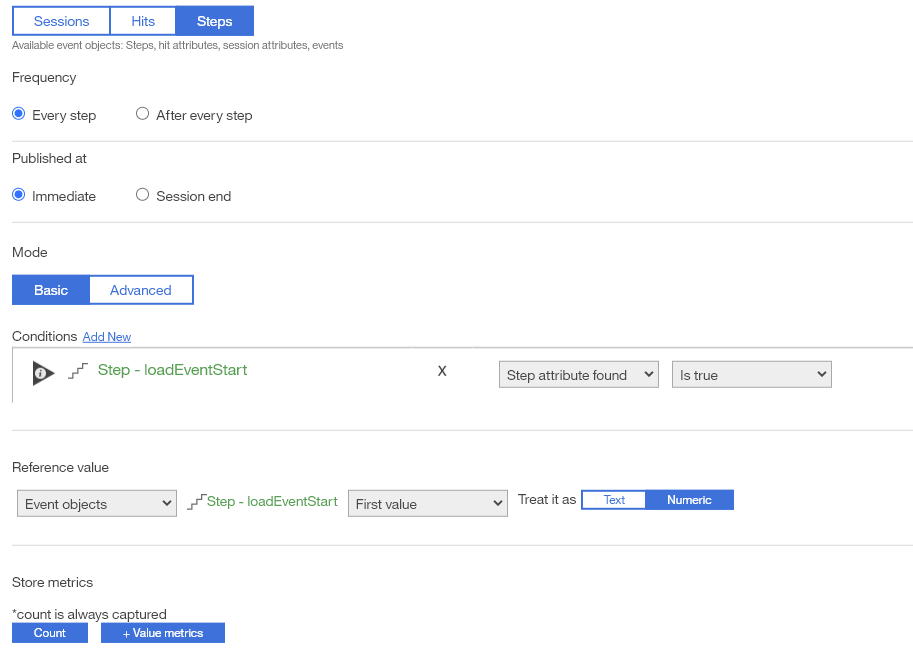
Once there are step attributes for each performance metric you wish to track, create an event for each metric. For each event, add a condition with the step attribute corresponding to the relevant performance metric and set it to ‘Step attribute found’ ‘Is true.’ Then, add the step attribute as the reference value. This value should be treated as Numeric rather than Text. If you wish to track value metrics such as Average, Min, Max, and Sum, ensure that the ‘+ Value metrics’ toggle is enabled.
Be sure to test each event to ensure it is working properly. By default, the unit for these metrics is milliseconds.
You may wish to track additional performance metrics which are calculated by taking the difference between two property values. For example, you could track Page Load Time by subtracting requestStart from loadEventStart. To do this, you will need to create an advanced event which contains the subtraction operation. Here is example code for an advanced event for Page Load Time:
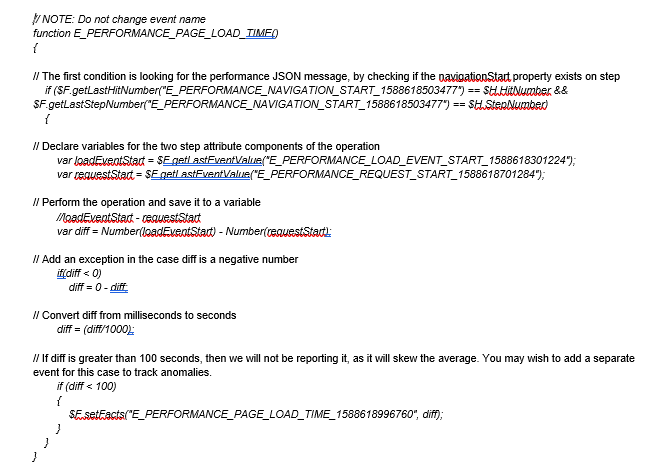
Some other useful metrics include:
- Network Duration: redirectStart - requestStart
- Time to First Byte : responseStart - requestStart
- Time to Last Byte: responseEnd - requestStart
- Time to Interactive: domInteractive - requestStart
- DOM Load Time: domComplete - domLoading
- Page Load Time: loadEventStart - requestStart
- TL Render Time: responseEnd - loadEventStart
When your events are ready, proceed to reporting:
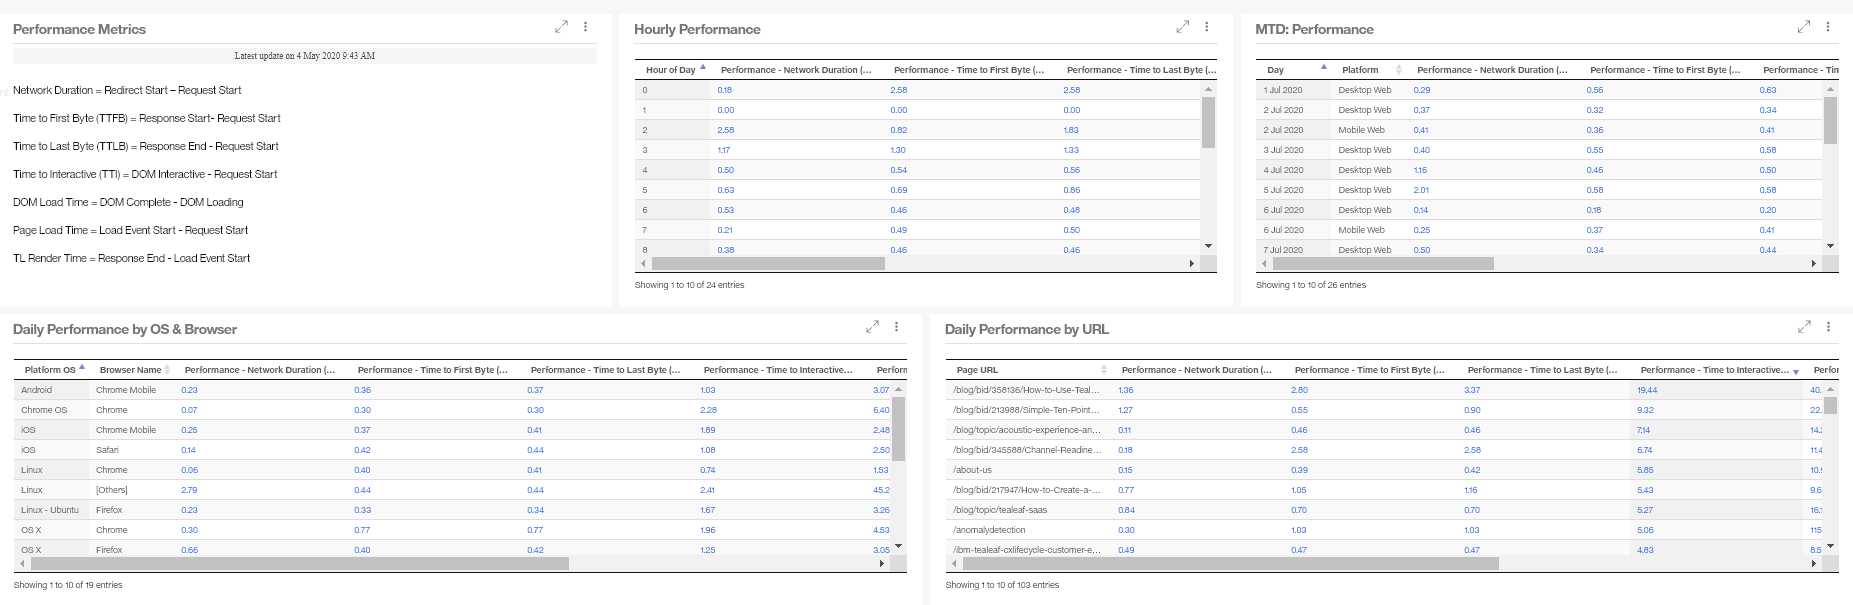
Take advantage of dimensions, breakouts and calculated metrics for deeper insight into your page performance.