What’s new in the redesigned IBM Digital Analytics User Interface?
A lot has evolved with the IBM Digital Analytics User Interface (UI) since its general release in June, and there is even more to come in the product roadmap over the upcoming months. For customers utilizing IBM Digital Analytics (aka Coremetrics), there are numerous new features in the UI that greatly increase user experience and functionality. The newly redesigned UI offers both improved performance and maximized usability in a responsive design that provides for unified digital analytics. For long time Coremetrics users, the time is now to start transitioning. Let’s explore what’s new in more detail.
Design improvements: More functionality in a refreshed new look
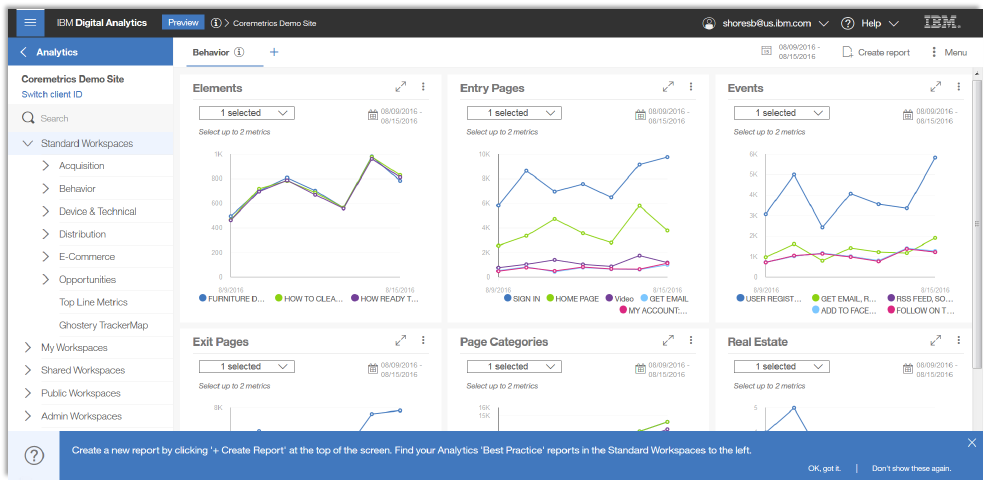
The design features in the updated IBM Digital Analytics UI presents you with an improved ease of navigation and a refined view of your reporting, allowing you to more quickly analyze your reports. The redesigned UI offers a modern and fresh look and is now tablet-friendly, so you can easily view your reports on the go. Users immediately realize improved navigation, with admin features added to the left navigation panel, and a “help banner” across the bottom of the page provides on-screen assistance to users of all experience levels.
One of the most beneficial improvements is the incorporation of a workspace for increased visualization and organization of your reports. The workspace allows you to better organize your analysis of reports, as tile cards or report tiles can be easily viewed and reorganized on the workspace, and a simple click allows you to expand the tile card into a larger report chart. Finally, a new compare window allows you to easily view and compare Top Line Metric reports, offering trended insights into your reported data, and saving you time and effort of manual comparisons.

Entitlement enhancements: Deeper reporting and powerful segmentation
The most compelling features of the redesigned IBM Digital Analytics UI are what it proffers in upgraded reporting and segmentation capabilities. While the legacy Digital Analytics UI offers a select number of Explore reports, the new UI offers unlimited report creation, offering all users the ability to create endless reports across client IDs. There is also extensive reporting capability with an integrated flexible report builder, and the new configuration panel makes it easier for you to build and edit a report. You can add more report columns and create a custom data range with no date limits – you can report on all stored data. The report processing options have also been expanded, and the integration of Tableau allows you to report your data in Tableau format. The new UI also provides performance improvements, especially for customers who have large amounts of data, segments and filters.
The new IBM Digital Analytics UI definitely makes your report data more robust. One of the key enhancements is the ability to apply unlimited segments to any report with any date range, as well as the ability to create new segments and apply the segments to previous reports you created. This powerful segmentation capability allows you to apply better iterative analysis in your reports, offering you even more valuable insight you can use to optimize your marketing efforts. Finally, the integration of Ghostery Trackermap provides a highly interactive graphic representation of the data flow from different monitoring methods used on websites. This information can help you identify unauthorized access on your pages, for example, as well as reveal other hard-to-detect site issues.
The new IBM Digital Analytics User Interface has a developed roadmap that will continue to help position you to optimize on your digital marketing efforts and enable you to more easily adopt Customer Experience Analytics to improve your customers’ experience across your website.
Preparing for the transition: Recommended next steps
While the legacy and new user interfaces will run in parallel through at least the end of this year, you will want to begin to take the necessary steps to prepare for a successful transition. This is the perfect time to give your current Coremetrics or IBM Digital Analytics implementation a tune up and start the move.
Take advantage of the available training and education including regional training sessions (in select cities), release overviews and self-paced webinars. Registration information and access to education and training can be found here.
If you would like additional information on the new IBM Digital Analytics User Interface or assistance in helping your company take advantage of IBM Customer Experience Analytics, please click on the tile below.
-resized-600.jpg?width=300&height=102&name=Pereion__Logo_(640x167)-resized-600.jpg)


