Introduction
Analysis that examines customer engagement across product pages can be a powerful tool in understanding where your site is performing at its best and where, perhaps, your pages could be better optimized. While customer engagement can be analyzed in various ways, in our earlier Product Page Optimization through Analytics formula, posted March 20, 2017, we used Tealeaf on Cloud to evaluate levels of customer engagement by taking a look at two components, tab engagement rates on product pages that have multiple tabs (i.e. overview tab, purchase tab, etc.) and click through rates (CTRs) by call to action (CTA) on product pages, and then compared the data sets to begin to understand the interrelationship between different elements of customer engagement on product pages. By taking the analysis a step further and applying Watson Analytics to our data, we can begin to explore additional correlations in the data and begin to uncover increased areas of opportunity.
Analysis Overview
By applying advanced analytic tools like Watson Analytics to available data sets, you can move beyond comparing exported sets of data in tables and generate additional views of your page performance metrics to gain a broader understanding of the correlation between the different elements of customer engagement and increased opportunities to optimize your customer experiences.
Analysis Benefits
- Provide additional insights to better understand customer engagement in your business, discover patterns of engagement and relationships that affect your business
- Discover new insights about your business or organization and identify best practices to optimize your site and anticipate opportunities to increase customer experiences.
Analysis Formula
This customer experience analytics (CXA) formula will utilize the sets of data tables we created using Tealeaf on Cloud for the Product Page Optimization formula and then apply Watson Analytics to generate powerful visualizations of the data and help discover insights on the correlations of the data that can be used to optimize your site and increase customer engagements.
As with previous formulas, this analysis is flexible and you should select the data assets for engagement metrics that are most applicable to your product pages, site and key performance indicators (KPIs.)
Step 1
Load data into IBM Watson Analytics to be used as a data asset. A data asset is a collection of data from external sources that is in the form of a table of rows and columns. Again, for this example, we will use our exported data tables from the Product Page Optimization formula to be used as data assets.
- To load a data file in Watson Analytics, tap “Data” from the landing page and then tap “New Data.” In the “Add data” box that appears, add your data asset. As we created multiple data tables in our earlier formula, we will repeat this step to add the multiple files. Finally, tap “Import.” After each file loads, the data assets will appear as tiles on the Data landing page.
- You can use various data sources as a data asset in Watson Analytics, including spreadsheets, .csv files, tweets and their metadata, data from Cognos Analytics, Hubspot, PayPal, SurveyMonkey and more.
- As the data asset(s) is loaded into Watson Analytics, it begins to evaluate the data and metadata, creates hierarchies from the metadata, and ultimately determines concepts to be used in analyses.
Step 2
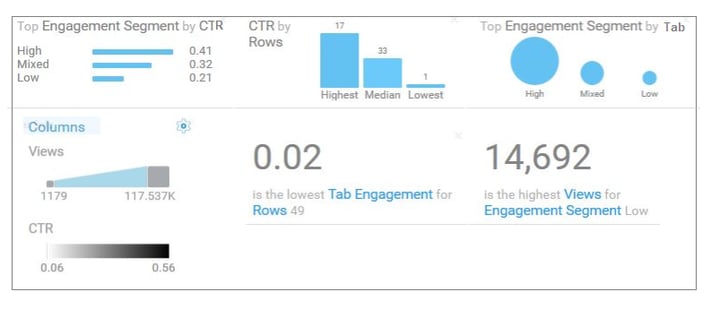
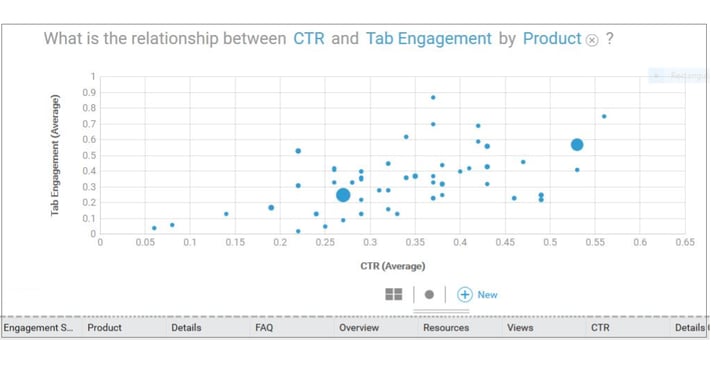
After your data is in Watson Analytics, use Discover to explore patterns and relationships in your data and to help identify hidden insights and opportunities. Watson Analytics analyzes your data asset and recommends several starting points that you can use to begin your data exploration. Or, you can ask a question or enter keywords to create your own starting points to examine your data. For our Product Page Optimization analysis, for example, we could ask “What is the relationship between CTR and Tab Engagements by Product?” or “What is the highest views for the lowest Engagement Segment?” to begin to explore the data. Discover in Watson Analytics essentially offers more details about your data by using impactful visualizations that provide new insights into the interrelationships between different data points.
- Create a Discovery Set. A discovery set contains one or more visualizations, each in its own tab. As such, you will want to name each tab to make it easier to find each discovery when you later assemble a dashboard or infographic in Display. For our example, we have named tabs for “Top Engagement Segment by CTR” and “Top Engagement Segments by Page Tab,” etc., in discovery sets for our Product Page Optimization analysis in Watson Analytics.
- To create a discovery set, tap the data asset on the Data landing page that you want to use. Or you can tap New discovery set on the Discover landing page and select a data asset.
- Select one of the starting points, ask a question and then select a starting point, or create your own visualization
- Start exploring your data and discovering new insights. You can explore the data that is shown in a visualization by using the interactive title, drilling up or down columns, viewing the details of a data point, or zooming in on a visualization. Watson Analytics allows you to change the visualization type and filter and sort your data, allowing you to discover new starting points for your exploration and identify new insights and opportunities within your data. For example, we can adjust our “timeframe” for Tab Engagements and CTR for our product page data from weekly to monthly to observe what impact it has on the data. Does the relationship between Tab Engagements and CTR change – and what is the impact of this adjustment?
Step 3
Finally, use Display in Watson Analytics to create dashboards or infographics that show your analysis and insights. To assemble a display using your data:
- Tap Display, then tap New display. Select a type of display.
- For dashboards and infographics, select a layout.
- Add discoveries from your discovery sets to the display and enhance your display by adding widgets such as text, media, web pages, images, and shapes.
- Limit the data that is shown by filtering the data in one or all visualizations and personalize your display by formatting it.
- To preview the look and feel of the display before sharing it with others, tap the Preview icon.
When it comes to understanding customer engagements on your site, it is important to know what is happening, why it is happening, and what insights you can gain through data analysis. While Tealeaf on Cloud can assist by building reports to help you begin to compare valuable data sets, pairing with the powerful analytics offered by Watson Analytics provides additional visualization opportunities, offering you increased insight to better understand your data and the correlation between different elements of customer engagement on your pages. What is the relationship between CTR and Tab Engagement on pages? Does a particular page reflect strong engagement activity due to a specific deliverable? What caused a page to have a high number of views but a low CTR on the page? Leveraging Watson Analytics with Tealeaf on Cloud, or utilizing the integrated Watson CXA solution, can help you get answers to your questions and gain new insights to make confident decisions about your business.