Introduction:
With the proliferation of e-commerce sites available for a customer’s purchasing pleasure, it is crucial that your site – and most importantly, your product pages – are optimized to attract customers and encourage their ongoing engagement with your site. However, when it comes to e-commerce page optimization, every site’s product pages can differ and what works for one site may not work for all. So, how do you find out what is working – and perhaps not working – for optimized customer engagement across your product pages?
Analysis Overview
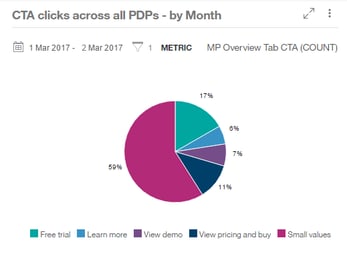
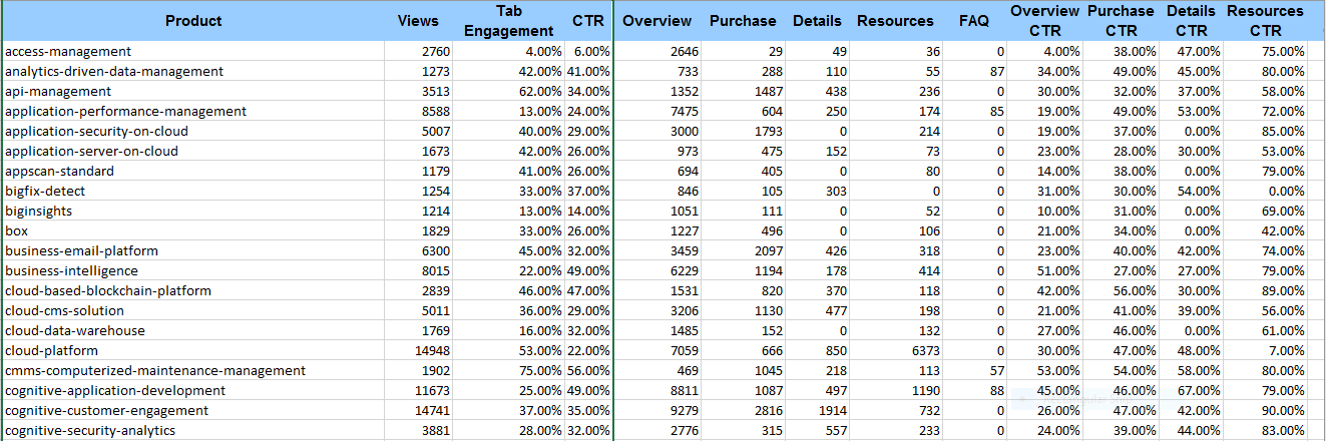
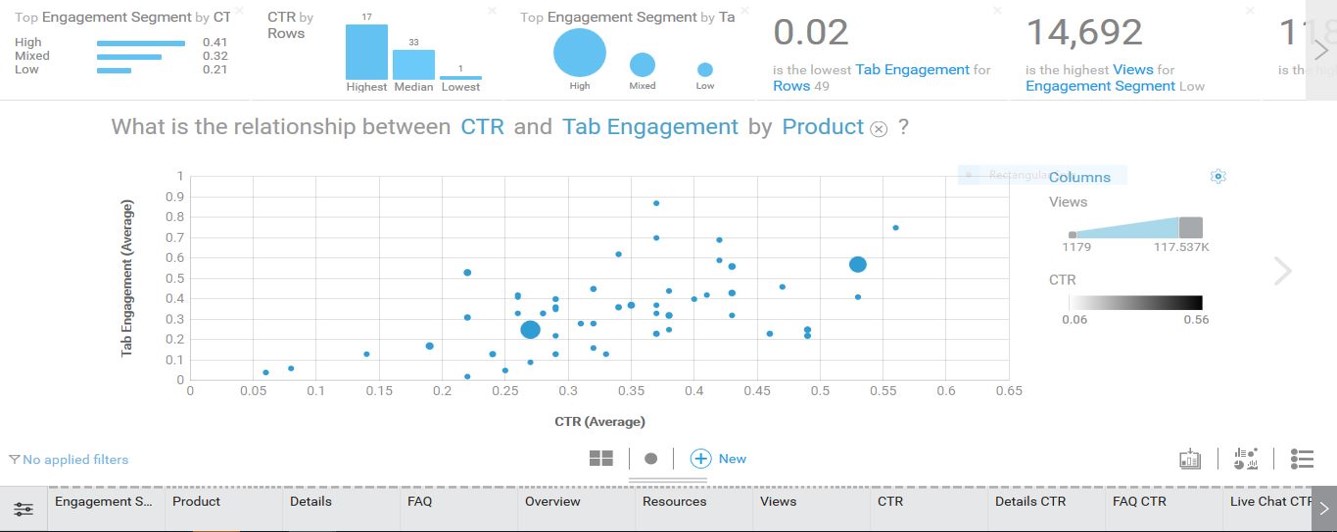
As product pages can be multi-dimensional, it is important to examine a couple of factors to better understand how – and how well – customers are interacting on your product pages. Specifically, in this analysis, we will take a look at two components to evaluate levels of customer engagement: tab engagement rates on product pages that have multiple tabs (i.e. overview tab, purchase tab, etc.) and click through rates (CTRs) by call to action (CTA) on product pages. We will then compare the data sets to begin to understand the interrelationship between different elements of customer engagement on product pages and to identify some best practices.
Analysis Benefits:
- Achieve a better understanding of customer engagement across your product pages to help determine what content is most effective in engaging customers and how interested they are in your products and learning about your business.
- Provide insight to identify the correlation between different elements of customer engagement on your product pages that can assist you with optimizing content to increase customer experiences and identifying best practices for engagement.
Analysis Formula
This customer experience analytics (CXA) formula will demonstrate how to build reports for basic page metrics that assist with insight into engagement and then apply advanced analytics to begin to highlight the correlation between the different elements of customer engagement.
This analysis is flexible and you should select the engagement metrics that are most applicable to your product pages, site and key performance indicators (KPIs.) So, while we have chosen to analyze engagements by tabs (for product pages comprised of different content tabs) and engagements through CTRS by CTA on product pages, you could easily choose to analyze other engagement metrics like duration of time spent on pages that have videos or downloads, for example, or bounce rates from pages. The important point is to select the key engagement metrics that will provide you the most insight into how customers are engaging on your specific product pages.
- To create a report, select “add widget” in the upper right of the Workspace area and click “create report widget.”
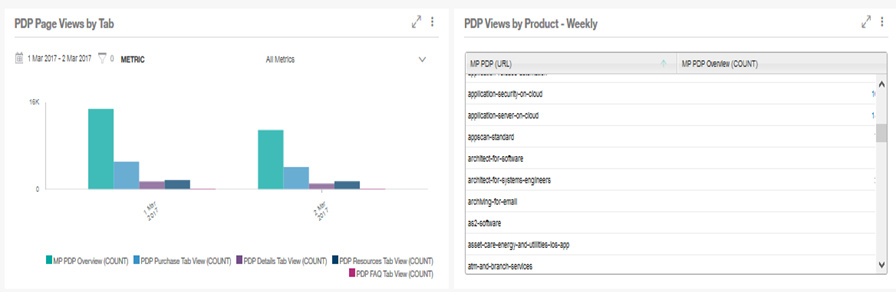
- Select the metric you want to use to populate the report. (Metrics will appear organized into Tags.) For our example, to build a report to show the page views for the product pages broken down by tabs, we would select the following metrics: Overview tab view count, Purchase tab view count, Details tab view count and Resources tab view count.
- Then, click “Generate chart,” and Report Builder is displayed. Report Builder is where you create all customized reports
- To add dimensions or breakouts to your report, click “add” next to “Breakouts”. Select the preferred breakouts from the list (i.e. day and hour, conversion/abandonment, etc.) and then click “Breakout data by selected.” For our report on the page views for each tab of the product pages, for example, we can select “Day” for the breakout and our report will provide a day to day view of the data.
- Select “Report options” in the upper right of the Workspace, and then select “Save as” and give the report a title and description. Then, select the Workspace (i.e. My Workspace, Shared Workspace, etc.) where you want this report widget to appear and then pin to a Workspace. Select the desired reporting period and adjust the report position as you would like it to appear on the Workspace.
- After saved to a Workspace, you can select “Share” in the upper right of the Workspace to share the widget with others or export the report. To export or schedule a report, select “report options” in upper right and select either “export” or “schedule a report.”
- To create a calculated metric, select “Build a new report” from the Workspace
- Then, select “create” next to “Metrics” to display the “Calculated metrics” User Interface (UI.) The calculated metrics UI will look a bit like a calculator.
- In order to perform calculations on data recorded by IBM Tealeaf, select the appropriate metric(s) from the tagged grouping of available metrics. (Metrics are really just saved events.) The selected metric(s) will highlight.
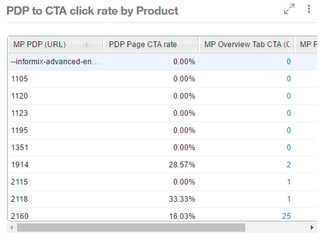
- Next, select “generate chart” and the metric(s) are then added to the palette. Now, we can perform our calculation and then save and display the calculated metric. Again, following our example in this analysis, we would select “Overview tab CTA (count)” and “Overview tab view (count)” as our metrics on which to perform a calculation. Once selected and added to the palette, we would select the “Overview tab CTA (count)” metric to be divided by the “Overview tab view (count)” metric to provide us with the calculated “Overview page CTA rate.” Once all necessary metrics have been selected and the metrics calculated, you would save this calculated report and place it on your Workspace, just like your other reports.